FIGURE SUMMARY
Title

A feed-forward loop between SorLA and HER3 determines heregulin response and neratinib resistance

Authors
Al-Akhrass, H., Conway, J.R.W., Poulsen, A.S.A., Paatero, I., Kaivola, J., Padzik, A., Andersen, O.M., Ivaska, J.
Source
Full text @ Oncogene

HER3 signaling regulates <italic>SORL1</italic> expression.

ASORL1 expression is significantly higher in breast cancer cell lines with high ERBB3 expression (CCLE; N = 59). RMA: robust multi-array average. Data are mean ± SD; statistical analysis: Mann–Whitney U. BSORL1 expression is higher in tumors with high ERBB3 and ERBB2 expression (cBioPortal; N = 476). Violin plot boxes represent median and 25th and 75th percentiles (interquartile range), and whiskers extend to maximum and minimum values. See methods for details on how the groups were defined. C Hrg β-1 increases SorLA levels. BT-474 cells were stimulated with 20 ng.mL−1 Hrg β-1 for the indicated times. Representative immunoblotting of SorLA, AKT(p)S473, total AKT, ERK1/2(p)T202/Y204, total ERK1/2, with α-tubulin as a loading control. D Quantification of SorLA levels normalized to loading control and relative to non-stimulated (0 h) cells. E Hrg β-1 increases SORL1 expression. Quantification of SORL1 mRNA levels, relative to HPRT1, determined with RT-qPCR in BT-474 cells stimulated with 20 ng.mL−1 Hrg β-1 for the indicated time points relative to non-stimulated (0 h) cells. F Representative immunoblotting of SorLA, AKT(p)S473, total AKT, ERK1/2(p)T202/Y204, total ERK1/2, with α-tubulin as a loading control from control (mCherry)- or Hrg β-1-overexpressing BT-474 cells. G Quantification of SorLA levels normalized to loading control and relative to control cells. H SMDF increases SorLA expression. BT-474 cells were cultured on a monolayer of mCherry-positive control or SMDF-overexpressing fibroblasts (TIFF). BT-474 cells were FACS sorted (see “Methods”) and cell lysates were analyzed for SorLA, AKT(p)S473, total AKT, ERK1/2(p)T202/Y204, total ERK1/2, with α-tubulin as a loading control. I Quantification of SorLA levels normalized to loading control and relative to control TIFF cocultured cells. J Representative immunoblotting of SorLA, HER2, and HER3, with α-tubulin as a loading control from parental BT-474 and brain-tropic metastasis variant BT-474-Br cells. K Quantification of indicated protein levels normalized to loading control and relative to BT-474 cells. L Quantification of SORL1 mRNA levels, normalized to HPRT1, determined with RT-qPCR in parental BT-474 and BT-474-Br cells relative to BT-474 cells. Unless otherwise indicated, data are mean ± SD from three independent biological experiments; statistical analysis: Student’s t test (unpaired, two-tailed, unequal variance).

Heregulin-induced <italic>SORL1</italic> regulation requires HER3 signaling through ERK1/2.

A Representation of the different SORL1 proximal promoter constructs (P1-7) used in luciferase assays with their corresponding molecular lengths (bp). B P3 is a responsive promoter sequence to Hrg β-1 stimulation. A control empty vector (EV) and P1-7 were individually expressed in BT-474 cells together with pRL-TK Renilla luciferase transfection control and cells were stimulated or not with 20 ng.mL–1 Hrg β-1 for 24 h. Shown are luciferase activities relative to the control sample (EV, PBS-treated). C Representative confocal microscopy images of P3-GFP promoter reporter construct-expressing BT-474 cells treated or not for 24 h with 20 ng.mL−1 Hrg β-1 in the presence or absence of 100 nM trametinib. Scale bars: 10 µm. D Quantification of the mean intensity of GFP signal per cell (whole-cell area). N = 36 cells per group. Three biological replicates. E Trametinib inhibits Hrg β-1-induced upregulation of SorLA. BT-474 cells were cotreated with 20 ng.mL−1 Hrg β-1 and either the pan-AKT inhibitor MK-2206 (2 µM) or the ERK pathway inhibitor trametinib (100 nM) for 48 h. Representative immunoblotting of SorLA, AKT(p)S473, total AKT, ERK1/2(p)T202/Y204, total ERK1/2, with GAPDH as a loading control. F Quantification of SorLA levels normalized to loading control and relative to non-treated cells. GSORL1 mRNA levels, relative to HPRT1, determined with RT-qPCR in BT-474 cells stimulated or not with 20 ng.mL−1 Hrg β-1 in the presence or absence of trametinib relative to non-treated cells. Data are mean ± SD from four (B) and three (F and G) independent biological replicates; statistical analysis: (B) Two-way ANOVA, Dunnett’s multiple comparisons test. (F and G) Student’s t test (unpaired, two-tailed, unequal variance). (D) Box plots represent median and interquartile range, and whiskers extend to maximum and minimum values; One-way ANOVA, Dunn’s multiple comparisons test.

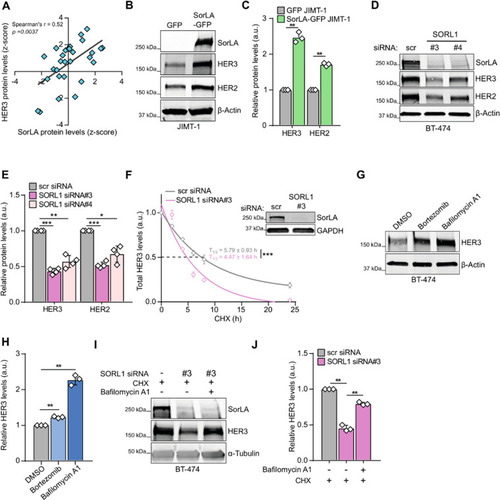
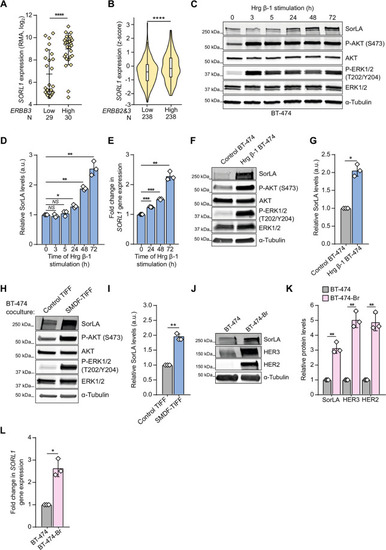
A SorLA and HER3 protein levels correlate positively in breast cancer cell lines (DepMap portal; N = 29). B–E HER3 and HER2 expression correlates with SorLA in HER2-positive breast cancer. B, C SorLA-GFP transfection in JIMT-1 cells increases HER2 and HER3 levels compared to GFP transfected cells. D, E. SorLA silencing in BT-474 cells decreases HER2 and HER3. B, D Representative immunoblotting of total HER2, HER3, and SorLA with β-actin as a loading control. C, E represent the respective quantifications of immunoblots in (B, D) with HER2/HER3 levels normalized to loading control and relative to control-silenced cells. F SorLA silencing decreases HER3 stability. RNAi transfected BT-474 cells were treated with 25 µg.mL−1 of CHX for the indicated time points and HER3 protein levels were determined by immunoblotting (see Fig. S3E). Shown are HER3 levels normalized to α-tubulin and relative to 0 h timepoint. Half-lives (T1/2) represent the time required for HER3 to decrease to 50% of its initial level. The least squares fitting method and extra-sum-of-squares F test were used to assess the statistical difference between curves from control and SorLA-silenced cells (P = 0.0002). A representative western blot validating SorLA silencing is shown. G HER3 is primarily degraded through the lysosomal pathway. BT-474 cells were treated with 1 µM of bortezomib or 50 nM of bafilomycin A1 for 4 h to inhibit proteasome and lysosome activities, respectively. HER3 expression was analyzed by immunoblotting, with α-tubulin as a loading control. H Quantification of HER3 levels normalized to loading control and relative to DMSO-treated control cells. I SorLA silencing triggers HER3 lysosomal degradation. SorLA-silenced BT-474 cells were cotreated for 4 h with CHX and bafilomycin A1. HER3 expression was analyzed by immunoblotting, with α-tubulin as a loading control. J Quantification of HER3 levels normalized to loading control and relative to CHX-treated control-silenced cells. Data are mean ± SD from three (C, F, H, J) or four (E) independent biological replicates. Statistical analyses: Student’s t test (unpaired, two-tailed, unequal variance) unless indicated otherwise. Scr: control non-targeting siRNA.

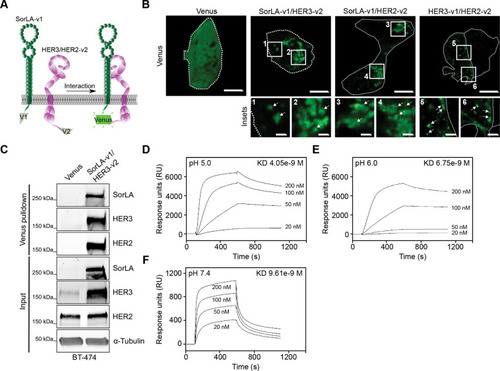
A A scheme depicting BiFC between SorLA-v1 and HER2/3-v2. B The indicated BiFC dimers were expressed in BT-474 cells and their interaction was assessed through imaging of reconstituted Venus. Cells are outlined with white dotted lines. Shown are representative confocal microscopy images and a control Venus-expressing cell showing diffuse fluorescence localization. Scale bars (main): 10 µm. Scale bars (insets): 2 µm. C Venus or SorLA-v1/HER3-v2 were transiently expressed in BT-474 cells. Cell lysates were subjected to nanobody pulldown (specific for the reconstituted Venus v1 + v2 dimer) and pulldowns and total cell lysates (input) were immunoblotted with the indicated antibodies. D–F. SorLA interacts with HER3 in a pH-dependent manner. SPR analysis on immobilized SorLA and a 20–200 nM concentration series of HER3 at pH 5.0 (D), 6.0 (E) and 7.4 (F). KD: equilibrium dissociation constant. Data are representative of three independent biological replicates.

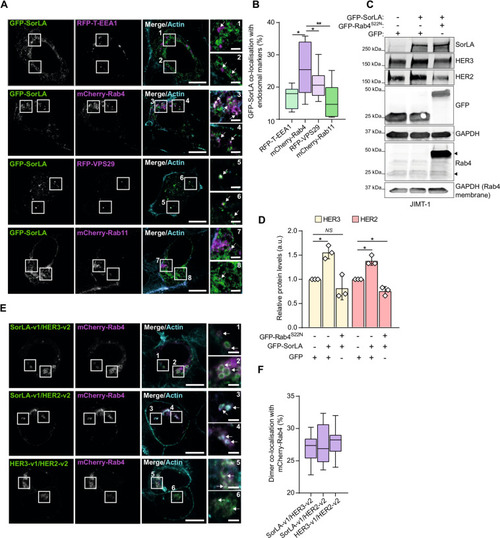
A Representative Airyscan confocal microscopy images of BT-474 cells coexpressing GFP-SorLA with the indicated endosomal markers. SiR-Actin was used for counterstaining the actin cytoskeleton. White arrows depict colocalizing signals. Scale bars: 10 µm. Scale bars (insets): 2 µm. B GFP-SorLA strongly colocalizes with mCherry-Rab4 in BT-474 cells. Colocalization was calculated (see “Methods”) from BT-474 cells transfected and imaged as in (A). N = 36 cells per group. C JIMT-1 cells were cotransfected with GFP-SorLA and either GFP control or GFP-Rab4S22N dominant-negative mutant. Representative immunoblotting of SorLA, HER2, HER3, GFP, and Rab4, with α-tubulin as a loading control. GFP immunoblot detects GFP control and GFP-Rab4S22N proteins. The higher molecular weight GFP-SorLA was probed with anti-SorLA primary antibody. In the Rab4 immunoblot, the upper arrowhead indicates GFP-Rab4S22N and the lower arrowhead the endogenous protein. D Quantification of HER2 and HER3 levels normalized to loading control and relative to control GFP-transfected cells. E Representative confocal microscopy images of BT-474 cells co-overexpressing mCherry-Rab4 with the indicated BiFC dimers. SiR-Actin was used for counterstaining the actin cytoskeleton. White arrows depict colocalizing signals. Scale bars: 10 µm. Scale bars (insets): 2 µm. F Colocalization analysis between BiFC and mCherry-Rab4. N = 30 cells per group. D Data are mean ± SD from three independent biological experiments; statistical analysis: Student’s t test (unpaired, two-tailed, unequal variance). B and F Box plots represent median and 25th and 75th percentiles (interquartile range), and whiskers extend to maximum and minimum values; three biological replicates. Statistical analysis: One-way ANOVA, Dunn’s multiple comparisons test.

SorLA expression determines heregulin response.

A SorLA silencing decreases cell viability in basal and Hrg β-1-enriched cell culture conditions. Control and SorLA-silenced BT-474 cells were stimulated or not with 20 ng.mL−1 Hrg β-1 for 48 h and cell viability was assessed using a WST-8-based method. Cell viability values are represented as fold change relative to unstimulated control BT-474 cells. A representative western blot validating SorLA silencing is shown. B Hrg β-1-expressing BT-474 cells were silenced for SorLA and cell viability was analyzed as in (A). A representative western blot validating SorLA silencing is shown. C, D SorLA silencing inhibits spheroid growth in Hrg β-1-enriched extracellular matrix. SorLA-silenced mCherry BT-474 cells were cocultured with Hrg β-1-overexpressing fibroblasts (Hrg β-1 TIFF) in matrigel for 12 days. Shown are representative live-cell images (C) and quantification of mCherry fluorescence reflecting spheroid growth (D). Data are mean ± SD from three independent biological replicates; statistical analysis: (A and D), One-way ANOVA, Dunn’s multiple comparisons test and (B), Student’s t test (unpaired, two-tailed, unequal variance). Scr = control non-targeting siRNA.

SorLA silencing specifically reverts resistance to neratinib in vitro and in vivo.

A, B SorLA silencing and neratinib show synergistic effects in inhibiting MDA-MB-361 cell growth. Control- and SorLA-silenced MDA-MB-361 cells were treated with either the pan-PI3K inhibitor buparlisib (500 nM), the pan-AKT inhibitor MK-2206 (500 nM) or the dual HER2/EGFR tyrosine kinase inhibitor neratinib (300 nM) for 48 h. Cell viability was measured using WST-8-based method. Values are represented as fold change relative to DMSO-treated control MDA-MB-361 cells. A representative western blot validating SorLA silencing is shown. C, D SorLA-silencing exhibits a synergistic effect with neratinib in inhibiting anchorage-independent spheroid growth of MDA-MB-361 cells in 3D low-attachment cell culture conditions. Control- and SorLA-silenced MDA-MB-361 cells were grown in low-attachment cell culture conditions for 7 days in the presence of the indicated treatments. Scale bar 100 µm. Spheroid sizes are quantified in and a representative western blot validating SorLA silencing are shown in (D). N > 50 spheroids per group. E Control and SorLA-silenced GFP-MDA-MB-361 cells were engrafted in the brain of zebrafish embryos and allowed to grow for 4 days in the presence of DMSO control or neratinib (400 nM). Representative GFP + Bright Field images of brain tumors are shown. Scale bars: 1 mm. Scale bars (insets): 100 µm. F Control- and SorLA-silenced GFP-MDA-MB-361 cells were engrafted in zebrafish brain and allowed to grow for 4 days in the presence of DMSO, buparlisib (2 µM), neratinib (400 nM) or MK-2206 (400 nM). Tumor growth is represented as fold change in GFP intensity relative to day 1 post-engraftment. A representative western blot validating SorLA silencing is shown. G A representative scheme of a neratinib resistance mechanism driven by a feed-forward loop supporting SorLA-HER2-HER3 expression. Key elements of this loop are highlighted in green boxes. HER2-HER3 signaling increases SORL1 expression through the ERK pathway. Increased SorLA levels prevent HER2-HER3 lysosomal degradation (red arrow with lined arrowhead) presumably by stimulating receptor recycling from Rab4-positive endosomes (green arrows). Data are (A and B), mean ± SD from three 3 independent biological replicates; (D), Box plots representing median and interquartile range; whiskers extend to maximum and minimum values, and (F), median with interquartile range. Statistical analysis: (A, B), two-way ANOVA, Dunnett’s multiple comparisons test. (D), One-way ANOVA, Dunn’s multiple comparisons test. (F), two-way ANOVA, Dunnett’s multiple comparisons test (main SorLA silencing effect P < 0.0001). Scr: control non-targeting siRNA.

Acknowledgments
This image is the copyrighted work of the attributed author or publisher, and ZFIN has permission only to display this image to its users. Additional permissions should be obtained from the applicable author or publisher of the image. Full text @ Oncogene