
- Title
-
Calcineurin controls proximodistal blastema polarity in zebrafish fin regeneration
- Authors
- Cao, Z., Meng, Y., Gong, F., Xu, Z., Liu, F., Fang, M., Zou, L., Liao, X., Wang, X., Luo, L., Li, X., Lu, H.
- Source
- Full text @ Proc. Natl. Acad. Sci. USA
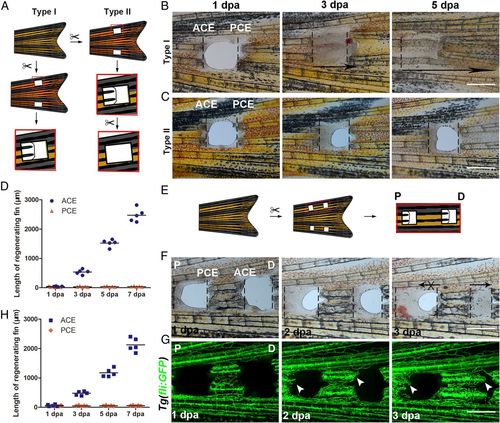
P–D regeneration polarity occurrs in zebrafish fins. (A) Schematic of two types of fin excavation. (B and C) Type I (n = 11/11) and II (n = 11/12) experimental strategies of unidirectional regeneration in zebrafish fins from ACE to the PCE. (D) Quantification of fin regenerative tissue lengths (in micrometers) of the ACE and PCE (n = 5). (E) Schematic of the two-hole excavation in the same two bony rays. (F and G) Images of bright fields and blood vessels in fin regeneration after two-hole excavations at 1, 2, and 3 dpa (n = 5/8). (H) Quantification of fin regenerative tissue lengths (in micrometers) with two-hole excavation (n = 5). P, proximal; D, distal. (Scale bar: 500 µM.) PHENOTYPE:
|
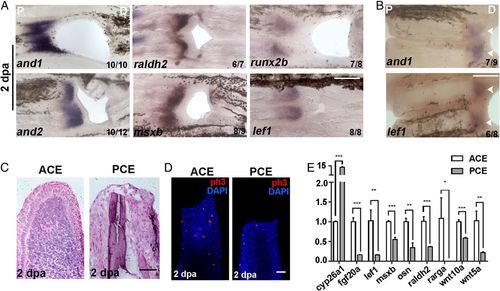
The PCE failed to form blastemas. (A) In situ hybridization of and1/2, raldh2, msxb, runx2b, and lef1 in regenerative fins at 2 dpa showing that blastemas were not built in the PCE. (B) and1 and lef1 were not expressed in the PCE with two-hole excavations. (C) Histological analyses of ACE (n = 6/8) and PCE (n = 5/6). (D) H3P antibody staining (red) was used to examine cell proliferation in the ACE (n = 7/10) and PCE (n = 7/9) DAPI counterstaining (blue). (E) qRT-PCR results comparing the differences in the relative expression of regeneration-associated genes for the PCE over the ACE (Student’s t test, *P < 0.05, **P < 0.01, ***P < 0.001). Data are presented as mean ± SD. P, proximal; D, distal. (Scale bars: 200 µM in A and B; 100 µM in C and D.) |

PCE blastemas are induced by calcineurin inhibition. (A) RNA-Seq course analysis of the ACE and PCE and the heat map of fragments per kilobase million (FPKM) values of the indicated genes. (B) Regenerative fins at 1, 3, and 5 dpa after dimethyl sulfoxide (DMSO) (n = 7/8) or FK506 treatment (n = 5/10). (C) Quantification of fin regenerative tissue lengths of the PCE (in micrometers) (n = 5). (D) Regenerative blastemas (indicated by arrows) occurred in zebrafish fins after FK506 treatment (n = 5/12) compared with DMSO (9/10) at 2 dpa. (E–G) and1, and2, and runx2b were expressed in the PCE after the FK506 treatment at 2 dpa. (H) Histological analyses of the PCE after DMSO (7/8) or FK506 treatment (5/8). (I) qRT-PCR results comparing the differences between the relative expression of regeneration-associated genes for FK506 or DMSO-treated PCE (Student’s t test, **P < 0.01, ***P < 0.001). Data are presented as mean ± SD. P, proximal; D, distal. (Scale bars: 500 µM in B–G; 100 µM in H.) |
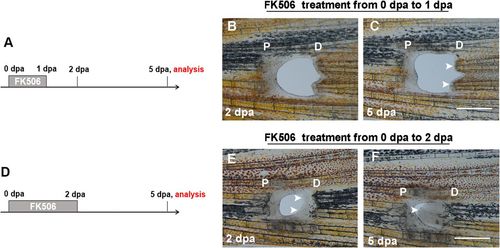
FK506-induced blastemas are essential to the continuous regeneration of the PCE. (A) Experimental scheme illustrating the FK506 treatment from 0 to 1 dpa and analysis at 5 dpa. (B and C) The FK506 treatment illustrated in A did not induce blastema formation and regeneration of the PCE (n = 6/7). (D) Experimental scheme illustrating the FK506 treatment from 0 to 2 dpa and analysis at 5 dpa. (E and F) The FK506 treatment was continuous up to 2 dpa when PCE blastemas formed (indicated by arrows), which led to the continuous regeneration of the PCE at 5 dpa (n = 5/9). P, proximal; D, distal. (Scale bars: 500 µM.) PHENOTYPE:
|
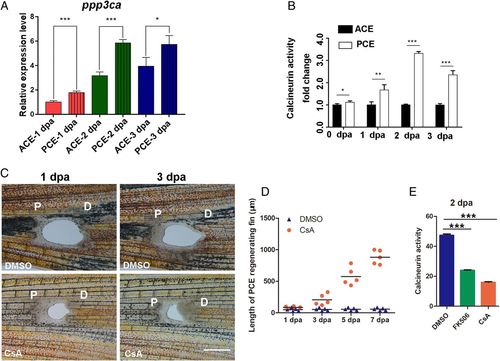
Obvious differences in calcineurin activity between the PCE and ACE. (A) The qRT-PCR analysis revealed that the ppp3ca expression of the PCE was higher than ACE (Student’s t test, *P < 0.05, ***P < 0.001). (B) Differences in calcineurin activity differences between the PCE and ACE at 0, 1, 2, and 3 dpa (Student’s t test, *P < 0.05, **P < 0.01, ***P < 0.001). Data are presented as mean ± SD. (C) PCE regeneration was induced by CsA treatment (n = 5/10) compared with DMSO treatment (n = 7/10). (D) Quantification of fin regenerative tissue lengths (in micrometers) of the PCE after FK506 or CsA treatment (n = 5). (E) Calcineurin activities of the PCE after FK506 or CsA treatment (n = 7, ***P < 0.001). P, proximal; D, distal. Data are presented as mean ± SD. (Scale bars: 500 µM.) |
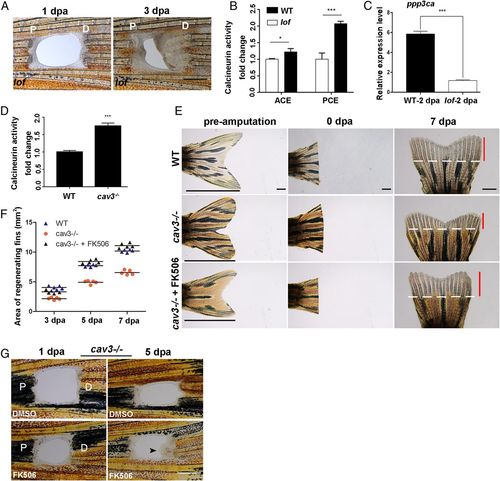
Endogenous calcineurin activity controls fin proximodistal regeneration. (A) PCE in the lof mutant regenerated (n = 5/6). (B) Fold change of calcineurin activities in lof mutant PCE or ACE normalized to control fins at 2 dpa (Student’s t test, *P < 0.05, ***P < 0.001). Data are presented as mean ± SD. (C) The expression of ppp3ca in the lof mutant at 2 dpa was lower compared with the control (Student’s t test, ***P < 0.001). Data are presented as mean ± SD. (D) Fold change of calcineurin activities in cav3 mutant regenerative fins normalized to control fins at 3 dpa (n = 7, Student’s t test, ***P < 0.001). Data are presented as mean ± SD. (E) Regeneration of the ACE was inhibited in cav3cq105 mutants (n = 8/8), while FK506 can rescue ACE regeneration at 7 dpa (n = 6/8) compared to WT (n = 7/8). White lines mark the amputation planes. Red lines show the extent of regenerative outgrowth, and black lines show the length of the entire uninjured caudal fin. (F) Quantification of the area of fin regenerative tissue (in square millimeters) (n = 5). (G) The regeneration of the PCE in cav3cq105 mutants was rescued by FK506 (n = 5/12) compared to control (n = 7/8). P, proximal; D, distal. (Scale bar: 500 µM in A and G; 2 mm in E.) |
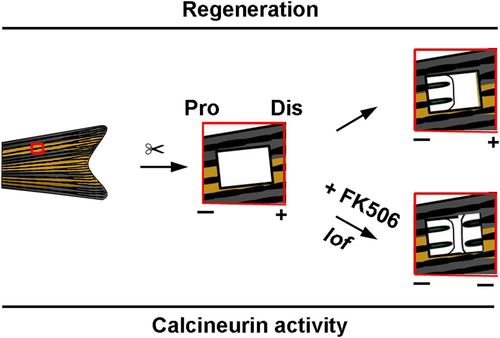
Proposed model of the functional roles of calcineurin activities in zebrafish fin regeneration along the P–D axis. The calcineurin activity of the PCE was higher than that of the ACE after fin excavation and calcineurin inhibition (FK506 treatment or lof mutant), which induced blastema formation and PCE regeneration. |