
- Title
-
Enteroendocrine cells sense bacterial tryptophan catabolites to activate enteric and vagal neuronal pathways
- Authors
- Ye, L., Bae, M., Cassilly, C.D., Jabba, S.V., Thorpe, D.W., Martin, A.M., Lu, H.Y., Wang, J., Thompson, J.D., Lickwar, C.R., Poss, K.D., Keating, D.J., Jordt, S.E., Clardy, J., Liddle, R.A., Rawls, J.F.
- Source
- Full text @ Cell Host Microbe
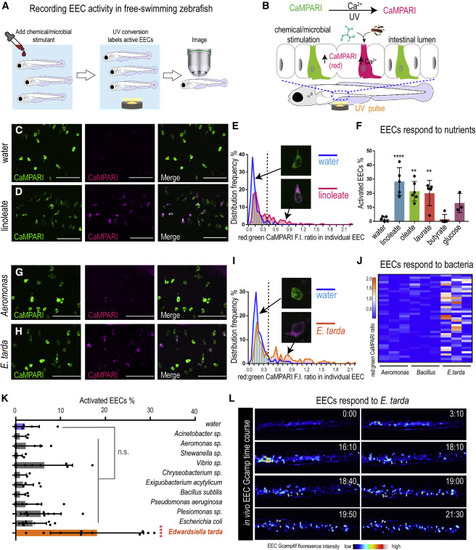
Figure 1. E. tarda activates zebrafish EECs in vivo (A) Experimental approach for measuring EEC activity in free-swimming zebrafish. (B) Method for recording EEC responses to chemical and microbial stimulants in the EEC-CaMPARI model. (C and D) Confocal projection of mid-intestinal EECs upon water (C, negative control) or linoleate (D) stimulation in Tg(neurod1:CaMPARI) following UV photoconversion. (E) Frequency distribution of EECs’ red:green CaMPARI fluorescence intensity ratio in water or linoleate-stimulated zebrafish. n = 177 for water group and n = 213 for linoleate group. (F) Percent EEC response in Tg(neurod1:CaMPARI) zebrafish. (G and H) Confocal projection of mid-intestinal EECs upon Aeromonas sp. (G) or E. tarda (H) stimulation in Tg(neurod1:CaMPARI) following UV photoconversion. (I) Frequency distribution of EECs’ red:green CaMPARI fluorescence intensity ratio in zebrafish treated with water or E. tarda. n = 117 for water group and n = 156 for E. tarda group. (J) Representative heatmap image showing Aeromonas sp., B. subtilis and E. tarda stimulated EEC red:green CaMPARI fluorescence ratio. (K) EEC activation in Tg(neurod1:CaMPARI) zebrafish stimulated with different bacterial strains. (L) Representative Tg(neurod1:Gcamp6f) zebrafish intestine stimulated with E. tarda. One-way ANOVA with Tukey’s post-test was used in (F) and (K). ∗p < 0.05; ∗∗p < 0.01; ∗∗∗p < 0.001; ∗∗∗∗p < 0.0001. |
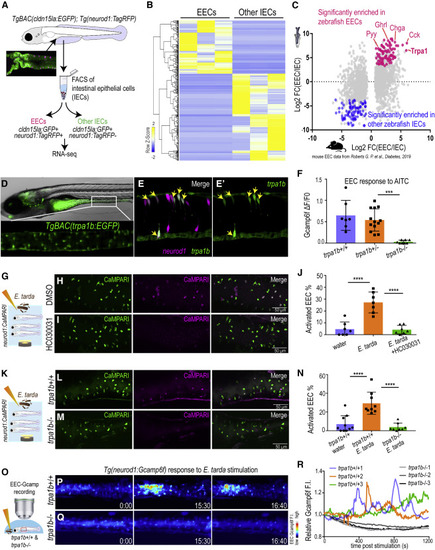
Figure 2. E. tarda activates EECs through Trpa1 (A) Schematic diagram of zebrafish EEC RNA-seq. (B) Clustering of genes that are significantly enriched in zebrafish EECs and other IECs (Padj < 0.05). (C) Comparison of zebrafish and mouse EEC-enriched genes. Mouse EEC RNA-seq data were obtained from GSE114913 (Roberts et al., 2019). (D) Fluorescence image of TgBAC(trpa1b:EGFP)(Pan et al., 2012). Zoom-in view shows the expression of trpa1b+ cells in the intestine. (E) Confocal projection of a TgBAC(trpa1b:EGFP);Tg(neurod1:TagRFP) zebrafish intestine. Yellow arrows indicate zebrafish EECs that are trpa1b:EGFP+. (F) Quantification of EEC Gcamp responses to Trpa1 agonist AITC stimulation in trpa1b+/+, trpa1b+/− and trpa1b−/− zebrafish. (G) Experimental design. (H and I) Confocal projection of Tg(neurod1:CaMPARI) zebrafish intestine stimulated with E. tarda with (H) or without the Trpa1 antagonist HC030031 (I). (J) Quantification of activated EECs in control and HC030031 treated zebrafish treated with water or E. tarda. (K) Experimental approach. (L and M) Confocal projection of trpa1b+/+ (L) or trpa1b−/− (M) Tg(neurod1:CaMPARI) intestine after stimulation with E. tarda. (N) Quantification of activated EEC percentage in WT and trpa1b−/− zebrafish treated with water or E. tarda. (O) Experimental design. (P and Q) Timed images of trpa1b+/+ (P) or trpa1b−/− (Q) Tg(neurod1:Gcamp6f) zebrafish stimulated with E. tarda. (R) Quantification of relative EEC Gcamp6f fluorescence intensity in trpa1b+/+ or trpa1b−/− zebrafish treated with E. tarda. One-way ANOVA with Tukey’s post-test was used in (F, J, and N). ∗p < 0.05; ∗∗p < 0.01; ∗∗∗p < 0.001; ∗∗∗∗p < 0.0001. |
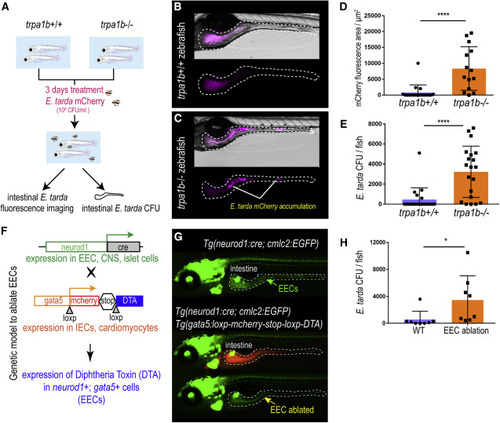
Figure 3. Activation of EEC Trpa1 signaling facilitates enteric E. tarda clearance (A) Schematic of zebrafish E. tarda treatment. (B and C) Representative image of trpa1b+/+ (B) or trpa1b−/− (C) zebrafish treated with E. tarda expressing mCherry (E. tarda mCherry). (D) Quantification of E. tarda mCherry fluorescence in trpa1b+/+ or trpa1b−/− zebrafish intestine. (E) Quantification of intestinal E. tarda CFU in trpa1b+/+ or trpa1b−/− zebrafish. (F) Schematic of a genetic model in which EECs are ablated via Cre-induced Diphtheria Toxin (DTA) expression. (G) Representative image of Tg(neurod1:cre; cmlc2:EGFP) and Tg(neurod1:cre; cmlc2:EGFP); TgBAC(gata5:RSD) with EECs that are labeled by Tg(neurod1:EGFP). (H) Quantification of intestinal E. tarda CFU in WT or EEC-ablated zebrafish. Student’s t test was used in (D, E, and H). ∗p < 0.05; ∗∗∗∗p < 0.0001. |
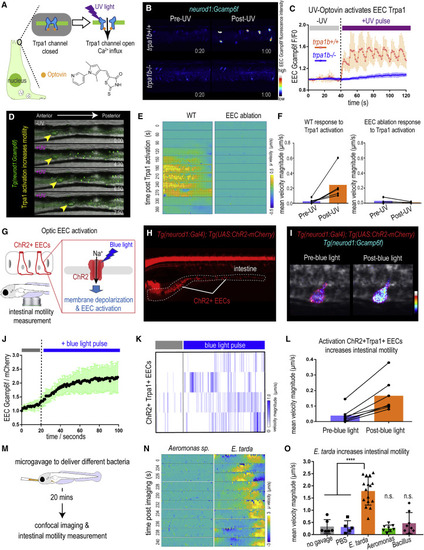
Figure 4. Activation of EEC Trpa1 signaling promotes intestinal motility (A) Illustration of EEC Trpa1 activation using an Optovin-UV platform. (B) Confocal image of trpa1b+/+ and trpa1b−/− Tg(neurod1:Gcamp6f) zebrafish EECs before and after UV activation. (C) Quantification of EEC Gcamp6f fluorescence changes in trpa1b+/+ and trpa1b−/− zebrafish before and after UV induction. (D) Representative images of Tg(neurod1:Gcamp6f) zebrafish intestine before and after UV-induced Trpa1 activation. Yellow arrowheads indicate the movement of intestinal luminal contents from anterior to posterior following EEC activation. (E) PIV-Lab velocity analysis to quantify intestinal motility in WT and EEC-ablated zebrafish. Spatiotemporal heatmap series representing the μ velocity of the imaged intestinal segment at the indicated time point post Trpa1 activation. (F) Quantification of the mean intestinal velocity magnitude before and after UV activation in WT and EEC-ablated zebrafish. (G) Model of light activation of ChR2 in EECs. (H) Fluorescence image of Tg(neurod1:Gal4); Tg(UAS:ChR2-mCherry) zebrafish that express ChR2 in EECs. (I) Confocal image of ChR2 expressing EECs in Tg(neurod1:Gcamp6f) intestine before and after blue-light-induced ChR2 activation. (J) Quantification of EEC Gcamp fluorescence intensity before and after blue-light-induced ChR2 activation. (K) Intestinal velocity magnitude before and after blue-light-induced activation in ChR2+Trpa1+ EECs. (L) Mean velocity magnitude before and after blue-light-induced activation in ChR2+Trpa1+ EECs. (M) Experimental design schematic for (N) and (O). (N) Heatmap representing the μ velocity of the imaged intestinal segment at indicated time points following Aeromonas sp. or E. tarda gavage. (O) Mean intestinal velocity magnitude in zebrafish without gavage or gavaged with PBS or different bacterial strains. Student’s t test was used in (O). ∗∗∗∗p < 0.0001. |
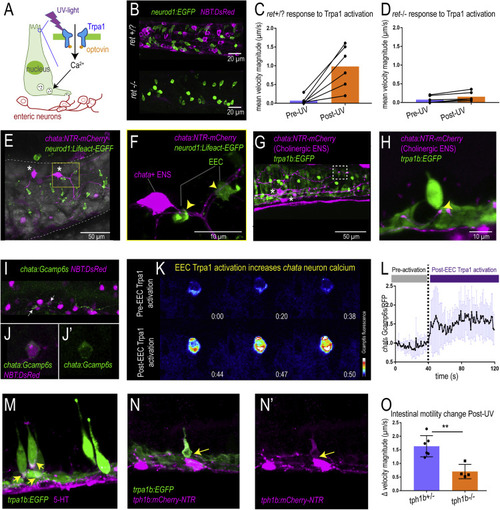
Figure 5. Activation of EEC Trpa1 signaling activates enteric cholinergic neurons and promotes intestinal motility through 5-HT (A) Working model showing Trpa1 stimulation in EECs activates enteric neurons. (B) Confocal image of ret+/? (ret+/+ or ret+/−) and ret−/− zebrafish intestine. neurod1 labeled EECs shown in green and NBT labeled ENS shown in magenta. (C) Quantification of mean intestinal velocity magnitude before and after EEC Trpa1 activation in ret+/? zebrafish. (D) Quantification of mean intestinal velocity magnitude before and after UV activation in ret−/− zebrafish. (E) Confocal image showing EECs (neurod1+; green) and cholinergic enteric neurons (chata+; magenta) in the zebrafish intestine. Asterisks indicate cholinergic enteric neuron cell bodies, which reside on the intestinal wall. (F) Higher magnification view indicates the EECs (green) directly contact nerve fibers that are extended from the chata+ enteric neuron cell body (magenta) as indicated by yellow arrows. (G and H) Confocal image showing Trpa1+EECs (green) form direct contact with chata+ enteric neurons (magenta). (I and J) In vivo calcium imaging of cholinergic enteric neurons. All the enteric neurons are labeled as magenta by NBT:DsRed. Yellow arrow indicates a chata+ enteric neuron that expresses Gcamp6s. (K) In vivo calcium imaging of chata+ enteric neuron before and after EEC Trpa1 activation. (L) Quantification of chata+ enteric neuron Gcamp6s fluorescence intensity before and after EEC Trpa1 activation. (M) Confocal image of TgBAC(trpa1b:EGFP) zebrafish intestine stained for 5-HT. Yellow arrows indicate the presence of 5-HT in the basal area of trpa1b+ EECs. (N) Confocal image showing zebrafish Trpa1b+ EECs (green) express Tph1b (magenta). (O) Quantification of intestinal motility changes in response to EEC Trpa1 activation in tph1b+/− and tph1b−/− zebrafish. Student’s t test was used in (O). ∗∗p < 0.01 |
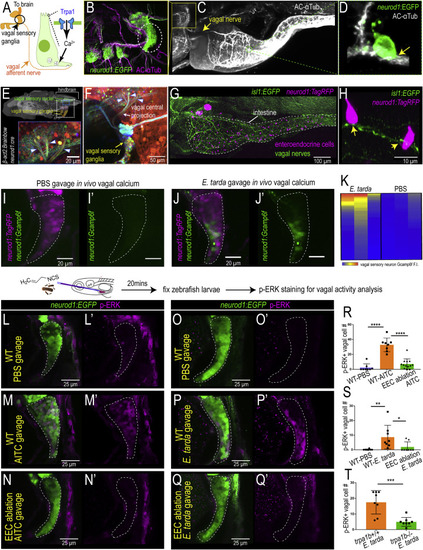
Figure 6. EEC Trpa1 signaling activates vagal sensory ganglia (A) Working model. (B) Confocal image of zebrafish vagal sensory ganglia labeled with Tg(neurod1:EGFP) (green) and AC-αTub antibody staining (magenta). (C) Lightsheet projection of zebrafish stained for AC-αTub. Yellow arrow indicates vagal nerve innervation to the intestine. (D) neurod1:EGFP+ EECs (green) directly contact vagal sensory nerve fibers labeled with αTub (white). (E) Confocal image of the vagal sensory nucleus in zebrafish larvae hindbrain where vagal sensory neurons project. Vagal sensory nerve fibers are labeled with different fluorophores through Cre-brainbow recombination in Tg(neurod1:cre); Tg(βact2:Brainbow) zebrafish. The 3D zebrafish brain image was generated using mapzebrain (Kunst et al., 2019). (F) Confocal image of vagal sensory ganglia in Tg(neurod1:cre); Tg(βact2:Brainbow) zebrafish. Asterisk indicates posterior lateral line afferent nerve fibers. Blue arrowheads indicate three branches from vagal sensory ganglia that project to the hindbrain. (G) Confocal image demonstrates the EEC-vagal network in zebrafish intestine. EECs are labeled as magenta by neurod1:TagRFP and the vagal nerve is labeled green by isl1:EGFP. (H) EECs (neurod1+; magenta) directly contact vagal nerve fibers (isl1+; green) as indicated by yellow arrows. (I and J) In vivo calcium imaging of vagal sensory ganglia in zebrafish gavaged with PBS (I) or E. tarda (J). (K) Quantification of individual vagal sensory neuron Gcamp6f fluorescence intensity in E. tarda or PBS-gavaged zebrafish. (L–N) Confocal image of vagal ganglia (neurod1+; green) stained with pERK antibody (activated vagal sensory neurons; magenta) in WT (L,M) or EEC-ablated zebrafish (N) gavaged with PBS (L) or Trpa1 agonist AITC (M,N). (O–Q) Confocal projection of vagal ganglia stained with pERK antibody in WT (O,P) or EEC-ablated (Q) zebrafish gavaged with PBS (O) or E. tarda (P,Q). (R) Quantification of pERK+ vagal sensory neurons in WT or EEC-ablated zebrafish following PBS or AITC gavage. (S) Quantification of pERK+ vagal sensory neurons in WT or EEC-ablated zebrafish following PBS or E. tarda gavage. (T) Quantification of pERK+ vagal sensory neurons in WT or trpa1b−/− zebrafish following E. tarda gavage. One-way ANOVA with Tukey’s post-test was used in (R) and (S) and Student’s t test was used in (T). ∗p < 0.05; ∗∗p < 0.01; ∗∗∗p < 0.001; ∗∗∗∗p < 0.0001. |
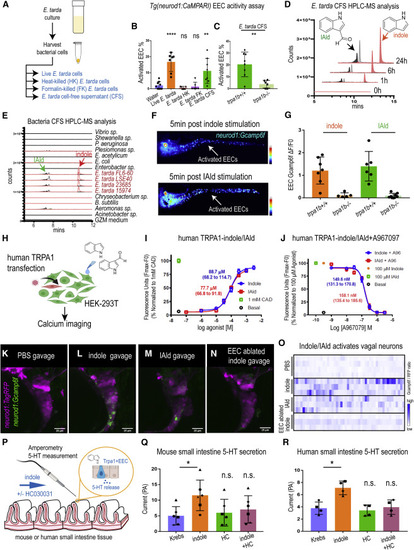
ure 7. E. tarda derived tryptophan catabolites activate Trpa1 and the EEC-vagal pathway (A) Method for preparing different fractions from E. tarda GZM (zebrafish water) culture. (B) Activated EECs in Tg(neurod1:CaMPARI) zebrafish stimulated by different E. tarda fractions. (C) Activated EECs in trpa1b+/+ and trpa1b−/− Tg(neurod1:CaMPARI) zebrafish stimulated with E. tarda CFS. (D) Screening of supernatants of E. tarda in GZM culture medium by HPLC-MS. Samples were collected at 0, 1, 6, and 24 h. Abbreviations are as follows: IAld, indole-3-carboxaldehyde; and IEt, tryptophol. Extracted ions were selected for IAld (m/z 145), IEt, (m/z 161), and indole (m/z 117). (E) Chemical profiles of Trp-indole derivatives from supernatants of various commensal bacteria in GZM medium for 1 day of cultivation. y axis values represent the production of Trp-indole derivatives normalized to CFU, with each strain beginning at zero. (F) Tg(neurod1:Gcamp6f) zebrafish stimulated by indole or IAld. Activated EECs in the intestine are labeled with white arrows. (G) Quantification of EEC Gcamp activity in trpa1b+/+ and trpa1b−/− zebrafish stimulated with indole or IAld. (H) Schematic of experimental design to test the effects of indole and IAld on human or mouse Trpa1. (I) Dose-response analysis of the integrated Calcium 6 fluorescence response above baseline (Fmax.-F0; maximal change in Ca2+ influx) as a function of indole and IAld concentration in human TRPA1 expressing HEK-293T cells. (EC50 = 88.7 μM, 68.2–114.7 μM 95% CI for indole; and, EC50 = 77.7 μM, 66.8–91.8 μM 95% CI for IAld) Concentration-response data were normalized to 1 mM CAD, a known TRPA1 agonist. Data represent the mean of 3–4 experiments, each performed with 3–4 replicates. (J) Dose-response analysis of A967079 inhibition of indole and IAld-induced Ca2+ influx. (IC50 = 149.6 nM, 131.3–170.8 nM 95% CI for indole; and, IC50 = 158.1 nM, 135.4–185.6 μM 95% CI for IAld) Concentration-response data of A967079 inhibition were normalized to response elicited by 100-μM agonist (indole or IAld). (K–N) In vivo calcium imaging of vagal sensory ganglia in WT (K-M) or EEC-ablated (N) Tg(neurod1:Gcamp6f); Tg(neurod1:TagRFP) zebrafish gavaged with PBS (K), indole (L,N) or IAld (M). (O) Quantification of individual vagal sensory ganglia cell Gcamp6f fluorescence intensities in WT or EEC-ablated zebrafish gavaged with PBS or 1 mM indole. (P) Schematic of amperometric measurements to examine the effects of indole on 5-HT secretion in mouse and human small intestinal tissue. (Q) Indole caused a significant increase in 5-HT secretion in mouse duodenum; however, no such effects were observed in the presence of Trpa1 antagonist HC030031. (R) Indole caused a significant increase in 5-HT secretion in human ileum; however, no such effects were observed in the presence of Trpa1 antagonist HC030031. Data in (B, C, G, Q, and R) are presented as mean ±SD. One-way ANOVA with Tukey’s post-test was used in (B and Q), Student’s t test was used in (C and H) and paired one-way ANOVA with Tukey’s post-test was used in (P–R). ∗p < 0.05; ∗∗p < 0.01; ∗∗∗p < 0.001; ∗∗∗∗p < 0.0001. |