
- Title
-
Taste buds are not derived from neural crest in mouse, chicken, and zebrafish
- Authors
- Yu, W., Wang, Z., Marshall, B., Yoshida, Y., Patel, R., Cui, X., Ball, R., Yin, L., Kawabata, F., Tabata, S., Chen, W., Kelsh, R.N., Lauderdale, J.D., Liu, H.X.
- Source
- Full text @ Dev. Biol.
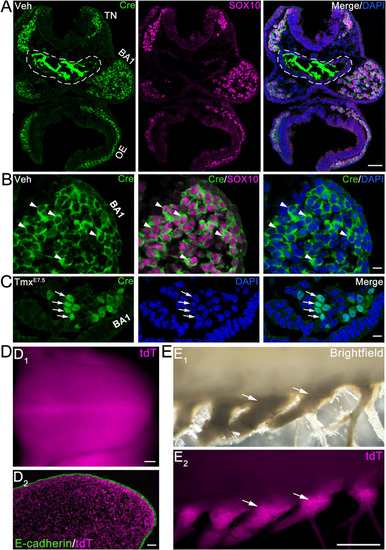
Fig. 1. Sufficiency of a single dose of tamoxifen (Tmx) in activating the nuclear translocation of Cre recombinase that triggered DNA recombination to drive tdT expression in NC and NC-derived tissues. A-B: Low (A) and high (B) -power images of transverse sections of the cranial region of a vehicle (Veh)-treated Sox10-iCreERT2 mouse embryo at E8.5 (12-somite). Immunosignals of Cre (green) in the cytoplasm (arrowheads in B) and Sox10 (magenta) in the nuclei were visualized. White dashed lines in A outline the foregut diverticulum with non-specific staining (Chen et al., 2017). TN: trigeminal NC tissue; BA1: branchial arch 1; OE: optic eminence. C: High-magnification images of the BA1 region in a transverse section of an E8.5 (9-somite) Sox10-iCreERT2 mouse embryo with tamoxifen activation of Cre (TmxE7.5). Arrows point to the Cre immunosignals (green) within nuclei. D: Images of whole mount (D1) and sagittal section (D2) of the tongue from a E12.5 Sox10-iCreERT2/tdT mouse embryo with tamoxifen activation of Cre (TmxE7.5). Tongue epithelium was immunoreacted with antibody against E-cadherin (green) in D2. E: Bright field (E1) and tdT fluorescent (E2) images of mouse dorsal root ganglia (arrows) of a Sox10-iCreERT2/tdT mouse at 8 wk with tamoxifen activation of Cre (TmxE7.5). Arrows point to the dorsal root ganglia. Scale bars: 50 μm in A and D (single-plane laser scanning confocal); 10 μm in B and C (single-plane laser scanning confocal); 1 mm in E (stereomicroscopy). |
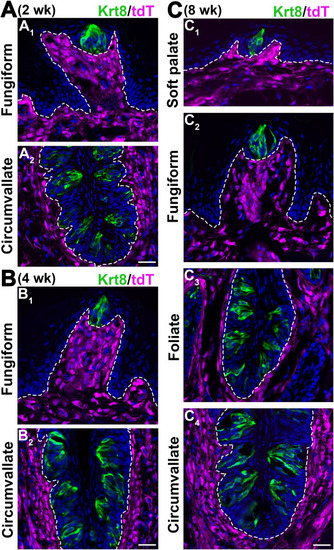
Fig. 2. Single-plane laser scanning confocal photomicrographs to demonstrate the distributions of Sox10-iCreERT2/tdT-labeled cells in the tongue and soft palate in postnatal mice (TmxE7.5) at different stages. A-B: Images of a fungiform papilla on a sagittal section (A1, B1) and circumvallate on a coronal section (A2, B2) of tongue at 2 wk (A) and 4 wk (B). C: Images of soft palate (C1), fungiform papilla (C2), foliate papilla on a sagittal section (C3), and circumvallate papilla on a coronal section (C4) of tongue tissue at 8 wk. Taste buds were marked by the immunosignals of Keratin 8 (Krt8, green). White dashed lines demarcate lingual epithelium from the underlying connective tissue. Scale bars: 50 μm for all images. |
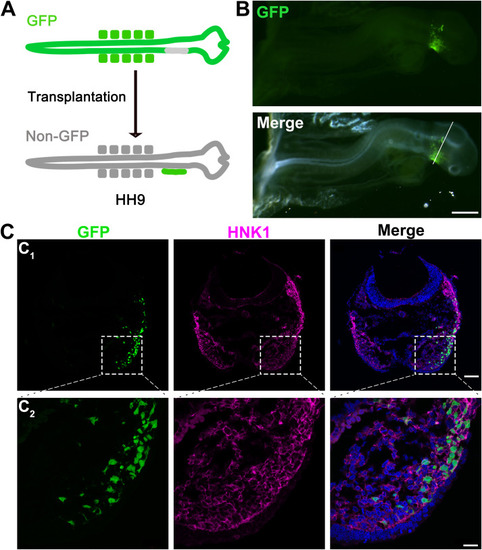
Fig. 3. Migration of GFP+ NC cells ventrally in GFP− host chicken after the insertion of the GFP+ neural fold. A: A schematic graph illustrating the insertion of GFP+ neural fold to GFP− host chicken embryo. B: Photomicrographs of a GFP+/GFP− chicken chimera at 1 DPS. Top: fluorescent image to show GFP signals; Bottom: merged fluorescent and bright-field images. C: Single-plane laser scanning confocal images of a section (C1) from the position indicated by white line in B and higher power images (C2) from the area indicated by dashed square shown in C1. Sections were immunoreacted for NC cell marker HNK1 (magenta). Scale bars: 500 μm in B; 80 μm in C1 and 20 μm in C2. |
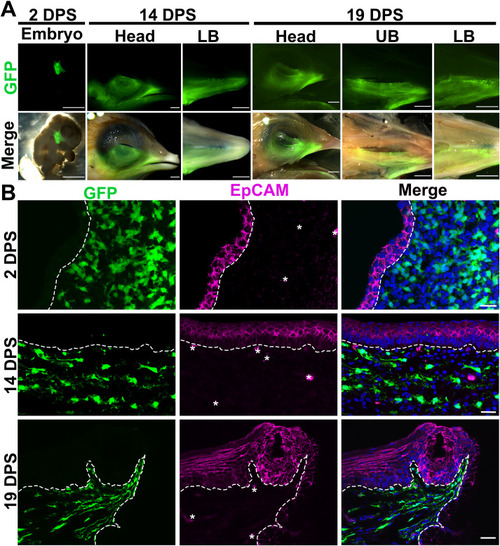
Fig. 4. Distribution of GFP+ neural fold-derived cells in the craniofacial regions ispilateral to the surgery side. A: Photomicrographs of a chimeric embryo at 2 DPS, side view of heads and dorsal view of the lower beak (LB) at 14 and 19 DPS, and upper beak (UP) at 19 DPS. Top panel: fluorescent images to show the GFP signals; Bottom panel: merged fluorescent and bright-field images. B: Single-plane laser scanning confocal images of sagittal sections of pharyngeal arch of chimeric embryo at 2 DPS and base of oral cavities of chimeric embryos at 14 and 19 DPS. Sections were immunoreacted for the epithelial cell marker EpCAM (magenta). White dashed lines demarcate the epithelium from the underlying mesenchyme. Scale bars: 2 mm in A; 20 μm in B. |
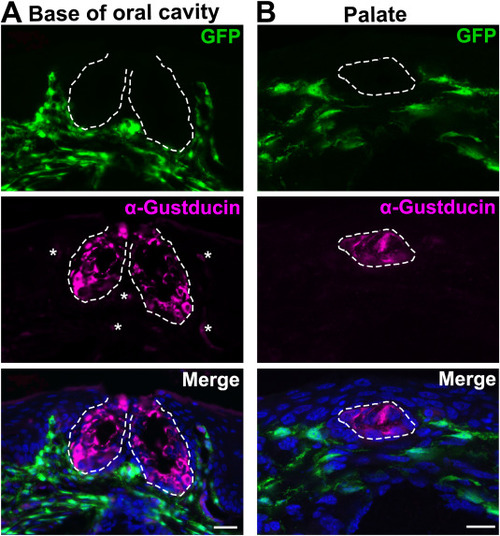
Fig. 5. Distribution of GFP+ labeled cells in the tissue of oral cavity of chimeric embryos at 19 DPS. A: Representative images of a sagittal section of the base of oral cavity. B: Images of a sagittal section of the palate. Sections were immunoreacted for taste bud cell marker α-Gustducin (magenta). White dashed lines encircle taste buds. Autofluorescence in α-Gustducin immunoreacted sections were identified and are marked by asterisks (∗). Scales bars: 20 μm for all images (single-plane laser scanning confocal images). |
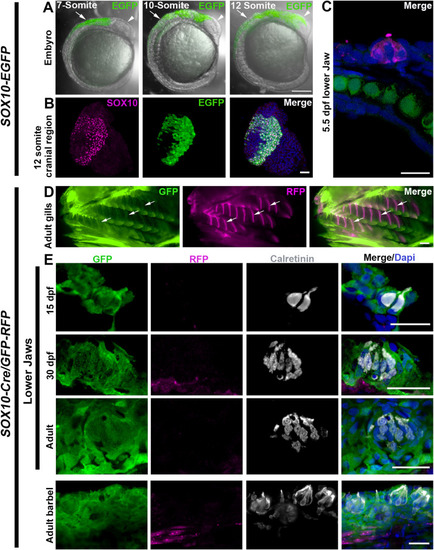
Fig. 6. Mapping NC cell lineages in zebrafish. A-C: Sox10-EGFP expression was in NC but not in taste buds. A: Merges EGFP and bright-field images of lateral views of Sox10-EGFP fish embryos at 7, 10, and 12-somite stages. Arrowheads point to heads and arrows point to truck regions. B: Photomicrographs of transverse sections of cranial regions of a 12-somite Sox10-EGFP fish embryo. Migrating NC cells were immunostained for Sox10 (magenta). C: Photomicrographs of a sagittal section of a taste bud in lower jaw of a 5.5 dpf fish embryo. D-E: Sox10-Cre/GFP-RFP labeled known NC-derived tissues but not taste buds. D: Whole mount images of gills (arrows) of Sox10-Cre/GFP-RFP adult zebrafish. E: Photomicrographs of sagittal sections of lower jaws at 15 dpf, 30 dpf and adult, and adult barbel of Sox10-Cre/GFP-RFP zebrafish. GFP and RFP signals were amplified by applying antibodies against GFP (green) and RFP (magenta). Calretinin (gray) indicates presence of taste buds. Scale bars: 200 μm in A and D; 50 μm in B; 20 μm in C and E (single-plane laser scanning confocal). |
Reprinted from Developmental Biology, 471, Yu, W., Wang, Z., Marshall, B., Yoshida, Y., Patel, R., Cui, X., Ball, R., Yin, L., Kawabata, F., Tabata, S., Chen, W., Kelsh, R.N., Lauderdale, J.D., Liu, H.X., Taste buds are not derived from neural crest in mouse, chicken, and zebrafish, 76-88, Copyright (2020) with permission from Elsevier. Full text @ Dev. Biol.