FIGURE SUMMARY
Title

Defect patterns on the curved surface of fish retinae suggest a mechanism of cone mosaic formation

Authors
Nunley, H., Nagashima, M., Martin, K., Lorenzo Gonzalez, A., Suzuki, S.C., Norton, D.A., Wong, R.O.L., Raymond, P.A., Lubensky, D.K.
Source
Full text @ PLoS Comput. Biol.

The cone mosaic is composed of four interpenetrating sublattices: two triangular sublattices and two honeycomb sublattices.

(A) Schematic of cone photoreceptors (colored by subtype) in apical plane of zebrafish retina. The ‘unit cell’ (yellow parallelogram) contains one UV cone, one Blue cone, two Green cones, and two Red cones. White dashed line: ‘row’ axis. Black dashed line: ‘column’ axis. (B) Cone mosaic from flat-mount retinal preparation of an adult, triple transgenic fish, Tg[sws2:GFP; trβ2:tdTomato; gnat2:CFP]. Blue cones express a fluorescent reporter (pseudo-colored blue) under control of the sws2 promoter, and Red cones express a fluorescent reporter (pseudo-colored red) under control of the trβ2 promoter. All cones express an additional reporter (pseudo-colored gray) under control of the gnat2 promoter. We distinguish between UV and Green cone subtypes based on morphology. (C) Schematic of photoreceptor epithelium, lining the outer surface of the hemispheric retina. The central retina, which surrounds the hemispheric pole and forms during the larval period, is unpatterned. As the retina grows by mitotic addition of new photoreceptors (and other retinal cells) at the hemispheric rim (gray arrows), there is a disorder-to-order transition (black dashed line). After this transition, the cone mosaic grows by neurogenesis at the hemispheric rim throughout the fish’s life. Because the hemispheric circumference grows, rows of cells are inserted to maintain approximately constant cell spacing. (D) UV and Blue cones in flat-mount retinal preparation from a double transgenic (Tg[sws1:GFP; sws2:mCherry]) line in which UV and Blue cones express distinct fluorescent reporters. UV cones (pseudo-colored magenta) form an anisotropic triangular sublattice that interpenetrates with an anisotropic triangular sublattice of Blue cones (pseudo-colored blue). We connect (white lines) a subset of nearest neighbors in the Blue cone sublattice. (E) Blue (pseudo-colored blue) and Red (pseudo-colored red) cones in flat-mount retinal preparation from panel B. Red cones neighbor Blue cones in each column. The Red cones form an anisotropic honeycomb sublattice. We connect (white lines) a subset of nearest neighbors in the Red cone sublattice; note the different nearest neighbor patterns in the Blue cone triangular sublattice (panel D) and the Red cone honeycomb sublattice (panel E). The Green cones form a honeycomb sublattice (not shown here).

A Y-Junction, a topological defect in the cone mosaic, is an insertion of a row and a column.

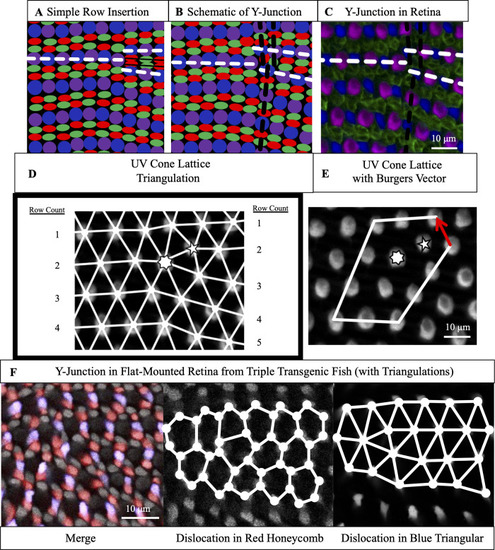
(A) Schematic of simple row insertion in cone mosaic. As new cone photoreceptors are incorporated to the right of the defect, a series of improper cone contacts (black box) within columns form. White dashed lines: rows associated with defect. (B) Schematic of a Y-Junction, a topological defect in the zebrafish cone mosaic. A Y-Junction only disrupts the cone mosaic near the core rather than along an entire line of contacts. White (black) dashed lines: rows (columns) associated with the defect. (C) A Y-Junction in a flat-mount retinal preparation from an adult, double transgenic (Tg[sws1:GFP; sws2:mCherry]) line in which UV and Blue cones express distinct fluorescent reporters (pseudo-colored magenta and blue, respectively) under control of UV and Blue opsin promoters, respectively. Antibody staining labels Red and Green cones (both pseudo-colored green). White (black) dashed lines: rows (columns) associated with the defect. (D) Each UV cone from panel C is connected (white bonds) to its nearest UV cone neighbors. To the left and right of the defect, rows are counted. Seven-sided (five-sided) star: seven-coordinated (five-coordinated) UV cone. (E) A circuit of triangulation bonds around defect from panels C-D. Red arrow is the Burgers vector, the additional bond necessary to close the circuit containing a dislocation. (F) Y-Junction in the same flat-mount retinal preparation as in Fig 1B. The round cells with dim fluorescence are UV cones. The Red cones are pseudo-colored red. The Blue cones are pseudo-colored blue. The remaining cones (bright gray fluorescence) are Green cones. We connect (solid white lines) nearest neighbors in the Red cone sublattice and Blue cone sublattice.

Y-Junctions form lines, called grain boundaries, from the center of the retina to the periphery.

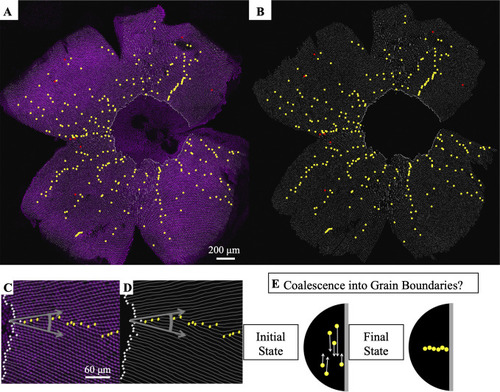
(A) Flat-mounted retina in which UV cones express a transgenic reporter (pseudo-colored magenta) under control of the UV cone opsin promoter. The dorsal side of the retina is left, ventral is right, temporal is down, and nasal is up. White lines: rows of UV cones. Yellow dots: Y-Junctions. Red dots: reverse Y-Junctions, generating row deletions. (B) Row tracing and identification of defects from retina in panel A. (C) Grain boundary from the retina in panel A. White squares indicate onset of patterning. Gray arrows indicate rotation of crystallographic orientation at the grain boundary. (D) Grain boundary presented in panel C with only the row tracing. White squares indicate onset of patterning. (E) Illustration of potential role of defect motion in generating the final spatial distribution of defects. Black region: photoreceptor epithelium. Gray region: retinal margin, where photoreceptor epithelium grows. Yellow circles: Y-Junctions. If defect motion does occur, it could allow defects to move together to form grain boundaries, as indicated by the white arrows. If defect motion is too slow, the patterning mechanism would instead have to generate grain boundaries during initial mosaic formation (not shown).

By photoconverting UV cones near the retinal margin, we track Y-Junction motion.

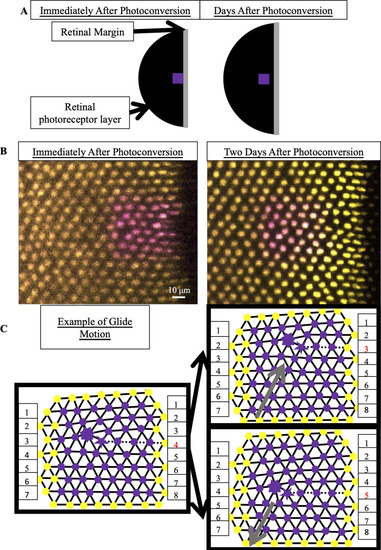
(A) Schematic of photoconverted UV cones in photoreceptor epithelium near the retinal margin. We photoconvert a patch of UV cones (purple box) near the margin, where new cone photoreceptors are incorporated by mitotic addition. After two, three or four days of retinal growth, we image the photo-converted region, which is now separated from the margin by newly added retinal tissue (black). (B) Example of patch of UV cones immediately after photoconversion and two days later. In this line (Tg[sws1:nEOS]), UV cones express a nuclear-localized, photoconvertible fluorescent protein under control of the UV cone opsin promoter. The non-photoconverted fluorescent protein is pseudo-colored yellow, and the photoconverted fluorescent protein is pseudo-colored magenta. Retinal margin is to the right of each image. Approximately eight columns of UV cones have been added in two days since photoconversion. (C) Glide motion involves subtle motion of individual UV cones near the Y-junction core. Magenta circles are UV cones with photoconverted fluorescent signal, and yellow circles are surrounding UV cones with non-photoconverted fluorescent signal. Every cone is connected to nearest neighbors. Five-sided and seven-sided stars: five-coordinated and seven-coordinated UV cones, respectively. Dashed black line: the “inserted” row. The two triangulations on the right describe positions of UV cones (from the left triangulation) after glide in the direction denoted by gray arrow. Note that the assignment of five- and seven-coordinated UV cones has shifted by one row.

By estimating the timescale of Y-Junction motion, we conclude that Y-Junctions line up into grain boundaries during initial mosaic formation rather than by subsequent Y-Junction motion.

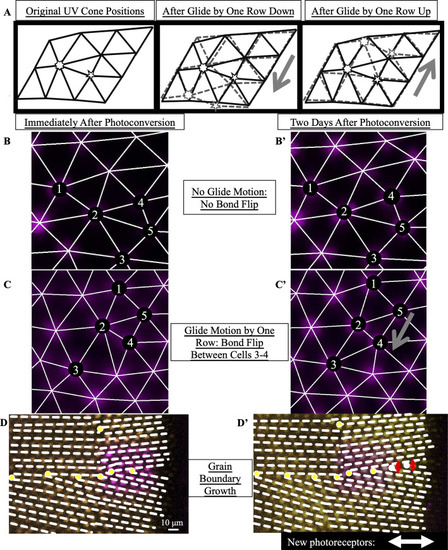
(A) Expected motion of individual UV cones in the case of glide motion by one row in either direction. Left triangulation shows UV cones near the defect core; a UV cone sits on each site of triangulation. The center and right panels overlay the positions of UV cones before (black) and after (gray) glide in the direction denoted by the gray arrows. Note that the originally five- and seven-coordinated UV cones in the black triangulation both become six-coordinated. (B,B’) Example of Y-Junction in photoconverted region in which no bond flips in two days. The photoconverted fluorescent signal in UV cone nuclei is pseudo-colored magenta. For reference, the same five cones are numbered in both images. White lines: triangulation of UV cones. (C,C’) Y-Junction in photoconverted region from Fig 4B. One bond has flipped in the triangulation over two days, meaning that the Y-Junction has glided in the direction of the gray arrow by a row. (D,D’) Observation of grain boundary growth during initial mosaic formation. Immediately after photoconversion, one observes seven Y-Junctions (yellow dots), six within a grain boundary and an isolated Y-Junction nearby. White dashed lines: rows of UV cones. Two days later, one observes two additional Y-Junctions in the grain boundary. Based on the constraint that a Y-Junction does not glide faster than one row in two days, Y-Junctions must have initially formed within the regions indicated by red arrows (thus, within the grain boundary). White double-headed arrow: columns of cones incorporated since photoconversion.

Cone mosaic formation is minimally disrupted in Red cone mutant but is significantly disrupted in UV cone mutant.

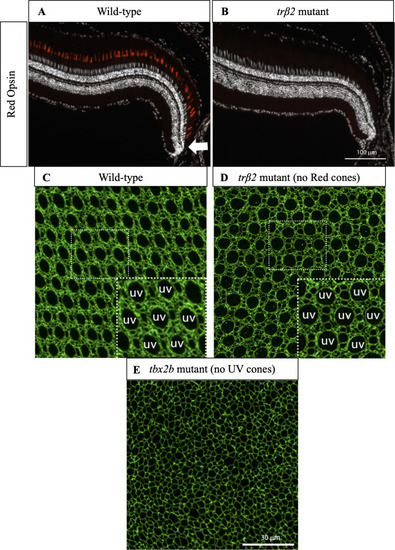
(A) Cross-section of wild-type retina in which immunostaining of Red cone opsin labels Red cones. White arrow indicates approximate location of precolumn area [40]. (B) Cross-section of trβ2 mutant in which immunostaining of Red cone opsin labels Red cones. Note absence of differentiated Red cones. White arrow indicates approximate location of precolumn area. (C) Apical plane of wild-type cone mosaic lattice in retinal flat-mount in which anti-ZO-1 stains cell profiles. UV cones are indicated in the inset. (D) Apical plane of cone mosaic in retinal flat-mount from trβ2 mutant, which lacks Red cones. Anti-ZO-1 stains cell profiles. UV cones (indicated in inset) identified based on large, rounded profiles. The triangular lattice of UV cones is minimally disrupted in absence of Red cones. (E) Apical plane of cones in retinal flat-mount from tbx2b mutant, which lacks UV cones. The cone mosaic is disrupted in this mutant.

PHENOTYPE:
Fish:
Observed In:
Stage: Adult

Phase-field crystal model of cone mosaic formation.

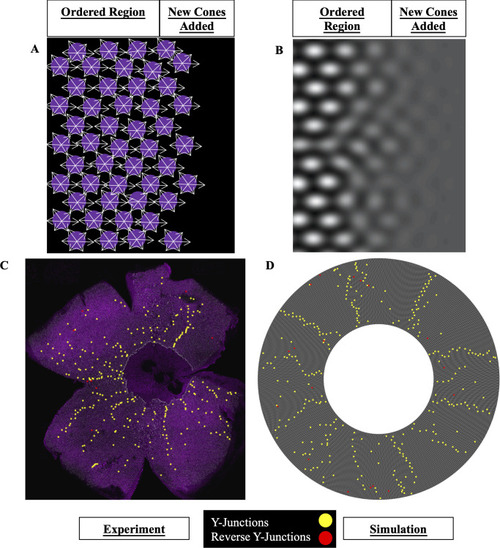
(A) Schematic of contact-interaction model in which fate-committed cones interact homotypically and form an anisotropic lattice. UV cones (magenta circles) interact with nearest neighbors of same subtype. White arrows: contact interactions. New fate-committed cones are incorporated to right of the ordered region. (B) In the phase-field crystal model, a continuum field describes the positions of UV cones. UV cones are most likely to be found around peaks in the density (white regions) and least likely to be found in troughs (dark regions). (C) Flat-mounted retina (same as Fig 3A and 3B) in which UV cones express a transgenic reporter under control of the UV cone opsin promoter. Yellow dots: Y-Junctions. Red dots: reverse Y-Junctions. (D) Simulation of phase-field crystal model on the surface of a cone. The number of initial rows and total number of columns are comparable to those in retinae, and this leads to a defect density similar to that measured in experiments. The degree of anisotropy of the triangular lattice is constrained by the anisotropy in unit cell dimensions measured in our live-imaging experiments. Yellow dots: Y-Junctions. Red dots: reverse Y-Junctions.

Acknowledgments
This image is the copyrighted work of the attributed author or publisher, and ZFIN has permission only to display this image to its users. Additional permissions should be obtained from the applicable author or publisher of the image. Full text @ PLoS Comput. Biol.