
- Title
-
Bioinformatic analysis and functional predictions of selected regeneration-associated transcripts expressed by zebrafish microglia
- Authors
- Issaka Salia, O., Mitchell, D.M.
- Source
- Full text @ BMC Genomics
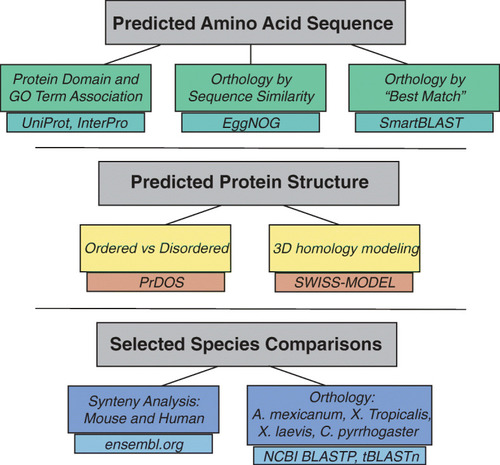
Overview of Bioinformatic Analysis for Functional Predictions. The diagram shows an overview of the bioinformatic analyses performed in order to make functional predictions about the genes of interest based on ( |
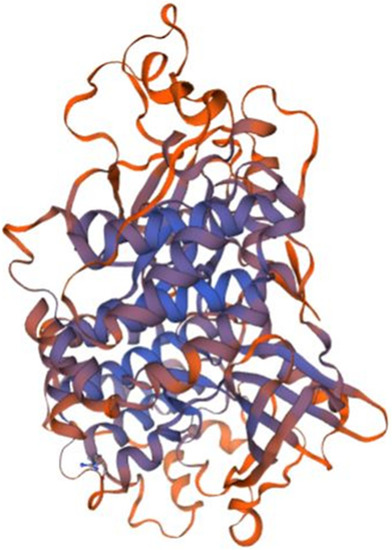
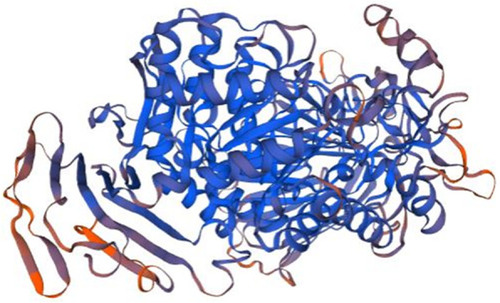
Homology model of P1 putative kinase domain. The kinase domain of Receptor-interacting serine/threonine-protein kinase 2 (RIPK2, 6fu5.1.B in the rcsb protein database) is the template used for the homology modelling of P1. The X-RAY diffraction 3.26 Å was used to determine the experimental structure of 6fu5.1 [ |
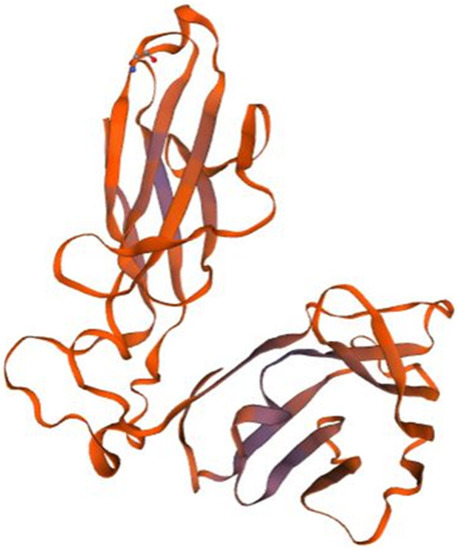
Homology model of P3. T cell receptor beta chain (3of6.1.A in the rcsb protein database) is the template used for the homology modelling of P3. The homology model starts from the P3 residue N°32 (THR, Threonine) and ends with the residue N° 245 (THR, Threonine). The X-RAY diffraction 2.80 Å was used to determine the experimental structure of 3of6.1.A [ |
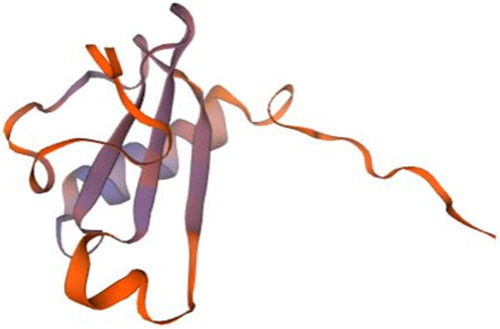
Homology model of P10 chemokine interleukin-8-like domain. Lymphotactin (1j8i.1.A in the rcsb protein database) is the template used for the homology modelling of P10. The homology model starts from P10 residue N°24 (GLU, Glutamic acid) and ends with the residue N° 102 (SER, Serine). The NMR spectroscopy was used to determine the experimental structure of 1j8i.1.A [ |
Homology model of P11. Maltase-glucoamylase, intestinal (3top.1.A in the rcsb protein database) is the template used for the homology modelling of P11. The X-RAY diffraction 2.9 Å was used to determine the experimental structure of 3top.1.A [ |
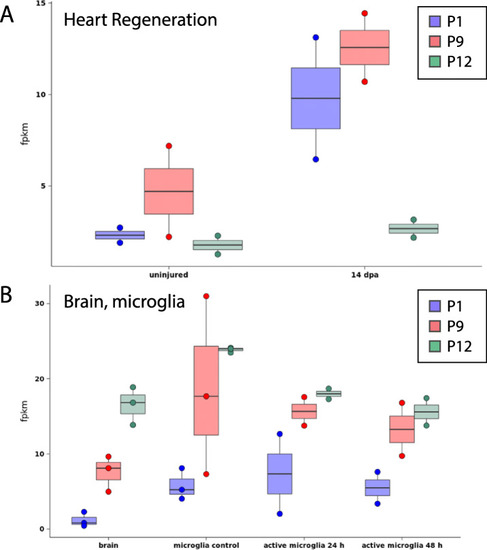
Expression level of selected zebrafish genes in other published studies. Expression level of selected zebrafish genes (P1, P9, and P12) in other published RNA-seq datasets of ( |