
- Title
-
Functional, molecular and morphological heterogeneity of superficial interneurons in the larval zebrafish tectum
- Authors
- Barker, A.J., Helmbrecht, T.O., Grob, A.A., Baier, H.
- Source
- Full text @ J. Comp. Neurol.
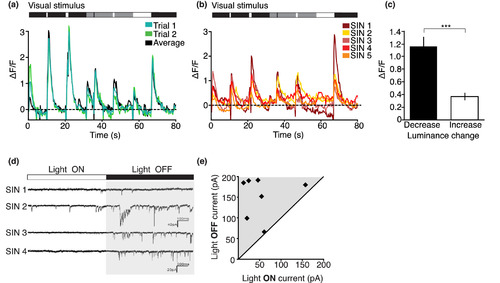
Many Gal4s1156t+ SINs are strongly tuned to changes in whole‐field luminance. (a) Example SIN from a 7dpf Gal4s1156t × UAS:GCaMP6s larva shows consistent responses (shown as ΔF/F) to whole‐field changes in luminance. (b) Responses to whole‐field luminance are highly consistent across larvae. Responses from five SINs from four Gal4s1156t × UAS:GCaMP6s larvae. (c) Gal4s1156t+ SINs are more responsive to darkening (decreasing luminance) whole‐field flashes than brightening (increasing luminance) whole‐field flashes (unpaired t‐test, p < .0001). (d, e) Electrophysiological recordings show increased excitatory synaptic input in response to transitions between light ON and light OFF conditions. (d) Four example traces from neurons targeted in Gal4s1156t × UAS:Kaede. EPSCs occur with greater frequency during low luminance (light OFF) conditions. (e) Total excitatory postsynaptic current is plotted for OFF and ON light conditions. For (c), n = 47 cells from 17 larvae. *** denotes p < .0005; Scale bar in (d), 20 pA, 200 ms. Error bars are SEM. Visual stimulus is shown above the corresponding example traces in (a), (b), and (d) |
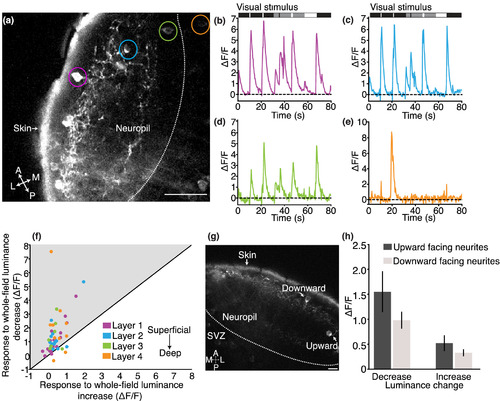
Gal4s1156t+ SIN responses to whole‐field luminance changes are consistent across tectal neuropil layers. (a) Imaging plane in a 7 dpf Gal4s1156t x UAS:GCaMP6s larva. (b) Example of a superficially positioned SIN (layer 1, magenta and indicated by magenta circle in (a), demonstrating a characteristic response to all luminance transitions. (c) Example trace of a SIN with its cell body positioned in an intermediate layer (layer 2, blue and indicated by blue circle in (a). (d) Example trace from a SIN with its cell body positioned in the deepest layer (layer 3, green and indicated by green circle in (a). (e) Gal4s1156t+ PVNs display more narrowly tuned response profiles to whole‐field luminance transitions. An example PVN (layer 4, orange and indicated by orange circle in (a)) trace is shown here. (f) Nearly all Gal4s1156t+ SINs (same cells as shown in Figure 1 plus 10 PVNs, n = 57 cells in 17 larvae) show greater responses to OFF than to ON, across all neuropil layers. (g) Gal4s1156t+ SINs either have upward‐ or downward‐oriented neurites. (h) OFF or ON responses are not significantly different between Gal4s1156t+ SINs with upward‐ or downward‐oriented neurites (unpaired t‐tests, p = .13 for OFF, p = 0.22 for ON). Scale bar in (a) = 20 μm, (g) = 10 μm. A, anterior; L, lateral; M, medial; P, posterior. Error bars are SEM |
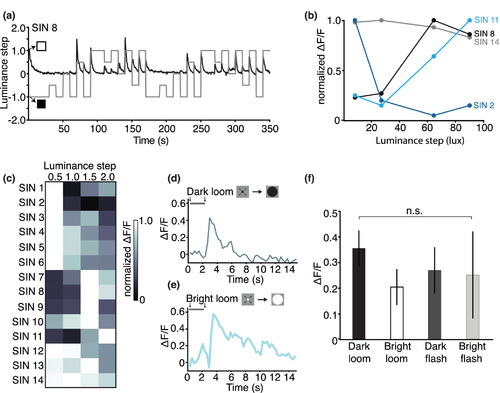
A subset of Gal4s1156t+ SINs display narrow tuning to incremental luminance changes. (a) Gal4s1156t+ SINs were tested in response to a luminance step stimulus. Four progressive whole‐field luminance steps from black (2.7 lux) to white (92.8 lux) were presented in both directions (darkening and brightening). Here responses from an example SIN (SIN 8 in (c)) in an 8 dpf Gal4s1156t × UAS:GCaMP6s larva are shown. Normalized luminance steps are indicated in gray, raw calcium responses are shown in black. Luminance steps of 0.5, 1.0, 1.5, and 2.0 correspond to lux changes of 8.2, 27.1, 64.5, and 90.1 lux respectively. (b) Luminance step tuning curves in 4 Gal4s1156t+ SINs demonstrate peak tuning distributed across the range of luminance steps tested (n = 14 cells, 8 larvae). The tuning curve for the SIN shown in (a) is plotted here in black. For this cell, the strongest calcium responses are observed at larger luminance steps, peaking with a luminance step of 64.5 lux and decreasing slightly at the largest step size tested (90.1 lux). (c) Luminance step responses are shown for all 14 SINs recorded in 8 larvae. Heat map shows normalized ΔF/F values for each cell. Luminance steps of 0.5, 1.0, 1.5, and 2.0 correspond to lux changes of 8.2, 27.1, 64.5, and 90.1 lux, respectively. Responses to OFF and ON steps were pooled. (d,e) Gal4s1156t+ SINs respond to bright and dark looming stimuli with similar response amplitudes and dynamics. Responses to dark (top) and bright loom (bottom) are shown for the same cell. The visual stimulus is displayed above each trace. (f) Gal4s1156t+ SINs do not show preferential tuning to bright or dark looming stimuli when compared to equivalent whole‐field flashes (n = 11 cells in 5 larvae, one‐way ANOVA, Tukey's correction, p = .787). n.s., not statistically significant. Error bars are SEM |
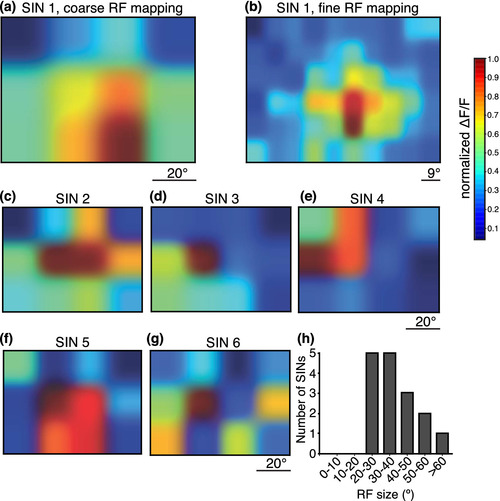
Gal4s1156t+ SINs have large receptive fields. Receptive fields of SINs were mapped using a 12‐square grid stimulus. White squares corresponding to 20° of the larva's visual field were flashed over the whole visual field on a black background. (a) An example SIN RF. (b) Finer mapping using a 60‐square grid for the same cell in (a) revealed a similar RF map. (c–g). Five additional examples of SIN RFs mapped with the 12‐square grid stimulus. Most cells had a central area of maximal activity (c–f). (h) RF areas for 26 Gal4s1156t+ SINs are plotted here. All RFs were greater than 20° of the larva's visualfield |
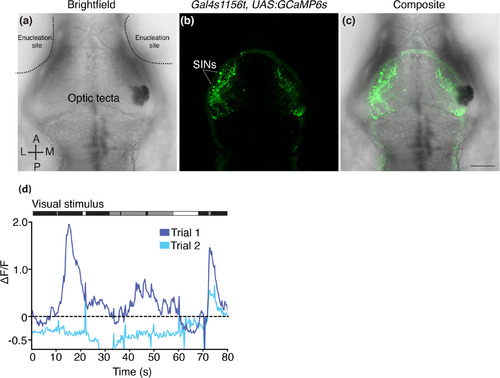
Gal4s1156t+ SIN whole‐field luminance responses require the retina. (a–c) 7 dpf Gal4s1156t × UAS:GCaMP6s larva with bilateral removal of retinal input. Enucleation sites and optic tecta are denoted in the brightfield image (a). Following enucleation, GCaMP6s+ SIN cell bodies are still clearly visible (b, c). (d) Example SIN from the larva shown in (a–c). Responses to luminance transitions are not consistent across trials and are not closely synced to the visual stimuli (shown above trace). Scale bar (a–c) = 100 μm |
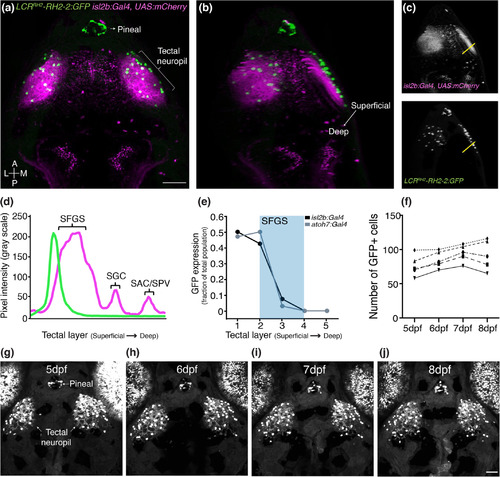
SINs are strongly and stably labeled by the LCRRH2‐RH2‐2:GFP transgene. (a) Top view of a 7dpf isl2b:Gal4 × UAS:mCherry × LCRRH2‐RH2‐2:GFP larva. GFP expression is observed in putative SINs as well as in the pineal gland and a subset of photoreceptor cones. (b) Rotated confocal volume of the same larva shown in (a). Note LCRRH2‐RH2‐2:GFP+ SIN cell bodies (green) line are anatomically restricted to SO (RGC axons labeled by mCherry, magenta). (c, d) Fluorescence intensity profile measurements along the yellow lines shown in (c). mCherry signal peaks correspond to SFGS, SGC, and SAC/SPV. (e) GFP expression, analyzed across multiple larvae crossed to either isl2b:Gal4 or atoh7:Gal4 x UAS‐mCherry, shows that LCRRH2‐RH2‐2:GFP+ SINs are restricted to SO (n = 20 larvae for isl2b:Gal4, 18 larvae for atoh7:Gal4, 7 dpf). (f) Label of LCRRH2‐RH2‐2:GFP+ SINs is stable over time. Number of GFP+ cells shown in 5 larvae over for each developmental age, respectively. (g–j) A single LCRRH2‐RH2‐2:GFP larva at 5 dpf (g), at 6 dpf (h), at 7 dpf (i), at 8 dpf (j). Scale bars in (a, j) = 50 μm. A, anterior; L, lateral; M, medial; P, posterior. Error bars are SEM |
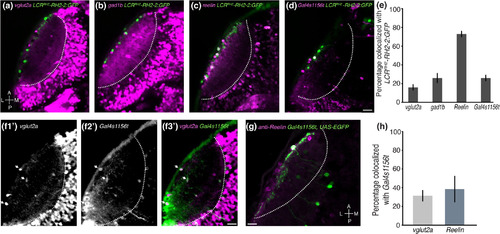
SINs are molecularly heterogeneous. (a–d) Representative examples of LCRRH2‐RH2‐2:GFP+ SINs, colabeled with previously identified SIN markers. (a) Crossing LCRRH2‐RH2‐2:GFP (green) to vglut2a:loxP‐DsRed‐loxP‐GFP (magenta) shows a small number of SINs express Vglut2a. Some, but not all, vglut2a+ SINs colocalize with GFP. (b) Crossing LCRRH2‐RH2‐2:GFP (green) to gad1b:loxP‐DsRed‐loxP‐GFP (magenta) shows that some, but not all, gad1b+ SINs colocalize with GFP. (c) Crossing LCRRH2‐RH2‐2:GFP (green) to reelin:Gal4 × UAS:RFP (magenta) shows that most GFP+ cells are reelin+. (d) Crossing LCRRH2‐RH2‐2:GFP to Gal4s1156t × UAS:RFP shows that some, but not all, GFP+ SINs are Gal4s1156t+. (e) Percentage of colocalized LCRRH2‐RH2‐2:GFP+ SINs with each of the marker lines tested in (a‐d) (n = 5 larvae, each condition). (f1′–f3′) Some, but not all, Gal4s1156t+ SINs colocalize with vglut2a:loxP‐DsRed‐loxP‐GFP (magenta). Individual channels are shown for vglut2a (f1′) and Gal4s1156t (f2′) signal in addition to the merged image (f3′). White arrows denote three examples of colocalization. (g) Some, but not all, Gal4s1156t+ SINs are reelin+. Representative immunostaining of a 8 dpf Gal4s1156t × UAS:EGFP larva stained with anti‐GFP (green) and anti‐Reelin (magenta). (h) Percentage of colocalized GFP+ SINs in Gal4s1156t with each reelin or vglut2a (reelin, n = 39 SINs in 4 larvae; vglut2a n = 79 SINs in 8 larvae). Scale bar (a–d) = 20 μm, (f, g) = 10 μm. A, anterior; L, lateral; M, medial; P, posterior. White hatched line indicates the neuropil and SPV boundary. Error bars, SEM |