- Title
-
Ccn2a/Ctgfa is an injury-induced matricellular factor that promotes cardiac regeneration in zebrafish
- Authors
- Mukherjee, D., Wagh, G., Mokalled, M.H., Kontarakis, Z., Dickson, A.L., Rayrikar, A., Günther, S., Poss, K.D., Stainier, D.Y.R., Patra, C.
- Source
- Full text @ Development
|
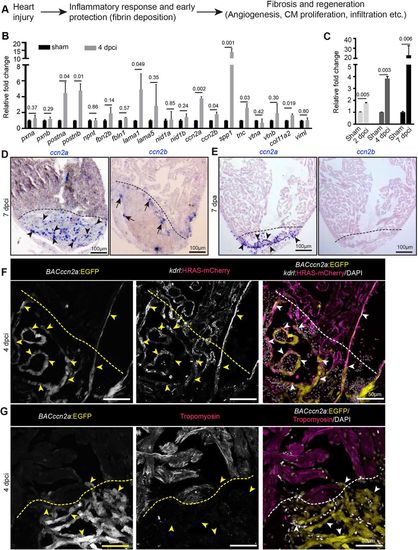
ccn2a is expressed by endocardial cells in injured zebrafish hearts. (A) Schematic depiction of the known processes involved in heart regeneration. (B,C) qPCR-based small-scale screen to identify dynamically expressed extracellular matrix genes in 4 dpci adult zebrafish hearts (B), and qPCR analysis of ccn2a expression during the early stages of heart regeneration (C) (n=3, each sample represents a pool of 6 hearts). Data are mean±s.d. Values are normalized to the mean of the sham control. The statistical significance of differences was evaluated using a two-tailed Student's t-test (GraphPad Prism). Mean Ct values are provided in Table S4. (D,E) Representative images of ccn2a and ccn2b expression on sagittal sections of 7 dpci (D) and 7 dpa (E) adult zebrafish hearts. Arrowheads and arrows indicate ccn2a- and ccn2b-expressing cells in the injured tissue, respectively. (F) BACccn2a:EGFP and kdrl:HRAS-mCherry expression in a sagittal section of a 4 dpci heart. Arrowheads indicate EGFP expression overlapping with mCherry positive-cells in the injured tissue. (G) BACccn2a:EGFP expression and tropomyosin (magenta; marks CMs) immunostaining on a sagittal section of a 4 dpci heart. Arrowheads indicate EGFP-expressing cells. Dashed lines indicate the wound border. dpci, days post cryoinjury; dpa, days post amputation. |
|
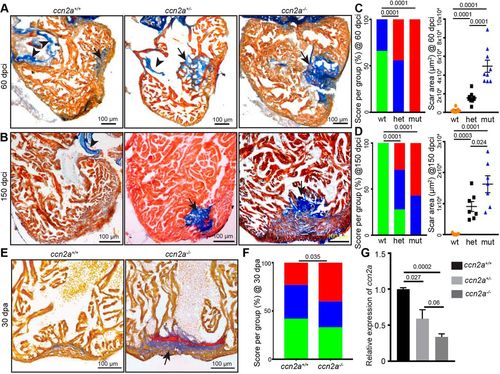
ccn2a mutant hearts exhibit increased scarring after injury. (A,B) Representative bright-field images of 12 μm sagittal paraffin sections of 60 dpci (A) and 150 dpci (B) hearts stained with acid fuchsin-orange G (AFOG; muscle, yellowish red; fibrin, brick red; collagen, blue). Arrows and arrowheads indicate the collagenous scar and atrioventricular valves, respectively. (C,D) Semi-quantitative analysis of scarring in ccn2a+/+, ccn2a+/− and ccn2a−/− hearts (n=9 each) at 60 dpci (C), and ccn2a+/+, ccn2a+/− and ccn2a−/− hearts (n=7 each) at 150 dpci (D). Color-coded bar chart indicates the degree of regeneration: green, complete; blue, moderate; red, very poor. Data indicate the percentage of total hearts represented by each score. The statistical significance of differences was evaluated by a wound-recovery χ2 test. Dot plots show highest area covered by collagenous scar on a tissue section from each heart. Data are mean±s.e.m. (E) Sagittal sections of 30 dpa ventricles stained with AFOG. Example of a vigorously regenerating ccn2a+/+ heart and a poorly regenerating ccn2a−/− heart section. Arrow indicates the collagenous scar. (F) Semi-quantitative analysis of wound recovery in 25 ccn2a+/+ and 30 ccn2a−/− animals. Average of area covered by collagen on three histological sections in each heart was considered for scar quantification. Color-coded bar chart indicates degree of regeneration: green, complete; blue, moderate; red, very poor. Data indicate the percentage of total hearts represented by each score. The statistical significance of differences was evaluated by a wound-recovery χ2 test. (G) qPCR analysis of ccn2a transcripts in 48 hpf embryos from three genotypes. Values are normalized to the mean of the wild type. Data are mean±s.d. dpci, days post cryoinjury; dpa, days post amputation; hpf, hours post fertilization. |
|
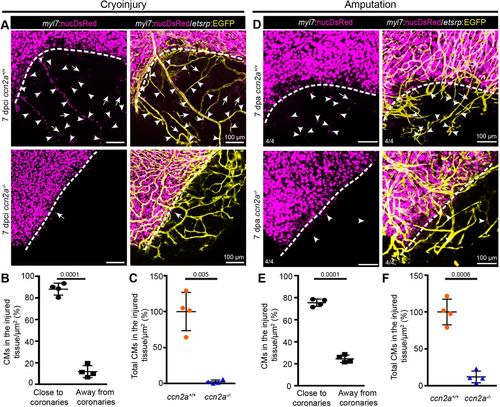
Cardiomyocyte tracking along new coronary vessels into injured tissue fails in ccn2a mutants. (A) Maximum intensity projections of confocal images of freshly isolated whole-mount heart evaluated for coronary angiogenesis and CM tracking along the new coronary vessels into the injured tissue. DsRed expression marks CM nuclei (magenta); EGFP expression marks coronary vessels (yellow). Arrowheads and arrows indicate CMs along and distant from new coronary vessels in the injured tissue, respectively. Dotted lines indicate the injury border. (B) Analysis of the percentage of the total infiltrated CMs observed along and distant from coronary vessels in the injured tissue quantified in wild-type whole-mount hearts (n=4). The total number of infiltrated CMs in the injured tissue of each sample was considered as 100%. (C) A comparison of the total infiltrated CMs in wild-type and ccn2a mutant whole-mount hearts at 7 dpci (n=4). The average for wild type was considered to be 100%. Data are mean±s.d. (D) Representative maximum intensity projections of confocal images of whole-mount heart freshly isolated at 7 dpa. DsRed marks CM nuclei; EGFP marks coronary vessels. Arrowheads and arrows indicate CMs residing along and distant from, respectively, new coronary vessels in the wound. Dotted lines indicate the wound border. (E) Analysis of the percentage of the total infiltrated CMs seen along and distant from coronary vessels in the injured tissue quantified in whole-mount wild-type hearts (n=4). Total number of CMs in the injured tissue of each sample was considered to be 100%. (F) A comparison of the total number of CMs in the injured tissue of wild-type and ccn2a mutant whole-mount hearts at 7 dpa. The average for wild type (n=4) was considered to be 100%. Data are mean±s.d. The statistical significance of differences was evaluated by a two-tailed Student's t-test (GraphPad Prism). Thickness of maximum intensity projections: 30 to 40 µm. |
|
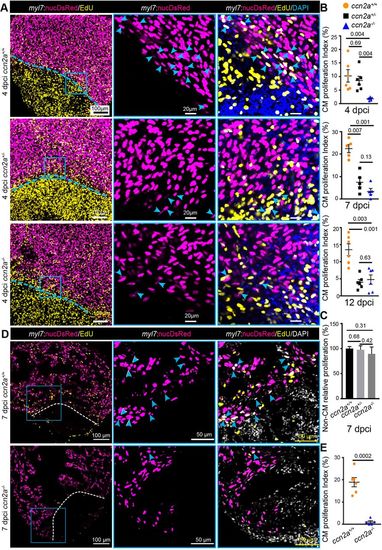
ccn2a mutants display reduced cardiomyocyte proliferation post-cryoinjury. (A) Panels in the left column show maximum intensity projections (25-35 µm) of confocal images of 4 dpci whole-mount hearts stained for EdU (yellow; marks proliferating cells) and stained with DAPI (blue; marks all nuclei). DsRed marks CM nuclei. The corresponding high-magnification single-plane optical sections are shown in the middle and right columns. Arrowheads indicate EdU+/DsRed+ cells. Dotted lines mark the injury border. (B) The percentage of proliferating CMs in the border zone (up to 100 µm away from the injury border) was quantified in whole-mount ccn2a+/+, ccn2a+/− and ccn2a−/− hearts at 4 dpci (n=6 each), 7 dpci (n=5 each) and 12 dpci (n=6 each). Graphs represent the percentage ratio of DsRed+/EdU+ CMs to the total number of DsRed+ CMs. (C) Percentage of non-CM proliferation quantified in whole-mount ccn2a+/+, ccn2a+/− and ccn2a−/− hearts at 7 dpci (n=3). The graph represents the ratio of EdU+/DAPI+ nuclei to the total number DAPI+ nuclei in the injured tissue. The mean wild-type control value was set to 100%. (D) Maximum intensity projections of confocal images of a 10 µm ventricular sagittal cryosection stained for EdU (yellow) and with DAPI (white; marks all nuclei). DsRed marks CM nuclei; arrowheads indicate EdU+/DsRed+ cells. Dotted lines indicate the injury border. (E) The percentage of proliferating CMs in the border zone (up to 100 µm away from the injury border) was quantified in ccn2a+/+ and ccn2a−/− hearts at 7 dpci (n=6). At least two sections from each heart were analyzed. Data are mean±s.e.m. in B and E, and mean±s.d. in C. The statistical significance of differences was evaluated using Mann–Whitney nonparametric tests (GraphPad Prism). |
|
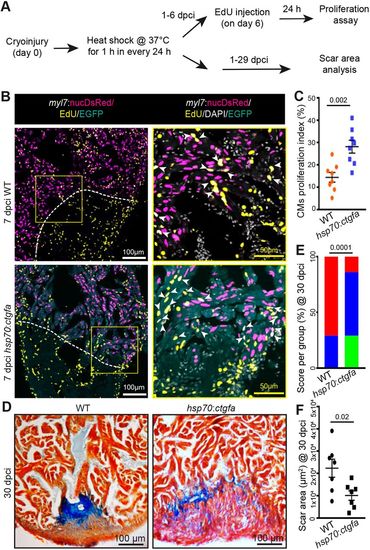
Ccn2a promotes cardiomyocyte proliferation and heart regeneration post-injury. (A) Schematic of the experimental procedures. Post-cryoinjury, wild-type and ccn2a-overexpressing transgenic animals were subjected to daily 1 h heat shock. CM proliferation was assessed at 7 dpci and scarring at 30 dpci. (B) Representative maximum intensity projections of confocal images of 10 μm sagittal cryosections of 7 dpci heart expressing DsRed in CM nuclei, immunostained for EGFP (cyan; marks cells expressing ectopic Ccn2a), stained for EdU (yellow; marks proliferating cells) and stained with DAPI (white; marks all nuclei). Arrowheads indicate EdU+/DsRed+ cells. (C) CM proliferation quantified in wild-type and ccn2a-overexpressing (hsp70:ctgfa) hearts at 7 dpci (n=8 each). At least two sagittal sections of each heart were analyzed for quantification. (D) Representative bright-field images of 12 μm sagittal paraffin sections of 30 dpci wild-type and hsp70:ctgfa hearts stained with AFOG (muscle, yellowish red; fibrin, brick red; collagen, blue). (E) Semi-quantitative analysis of scarring in wild-type and ccn2a-overexpressing (hsp70:ctgfa) hearts at 30 dpci (n=7 each). The histological section with the largest area covered by collagen in each heart was considered for scar quantification. Color-coded bar chart indicates degree of regeneration: green, complete; blue, moderate; red, very poor. Data indicate the percentage of total hearts represented by each score and the statistical significance of differences was evaluated by a wound-recovery χ2 test. (F) Dot plot shows highest area covered by collagenous scar on a tissue section from each heart. Data are mean±s.e.m. in C,F. |
|
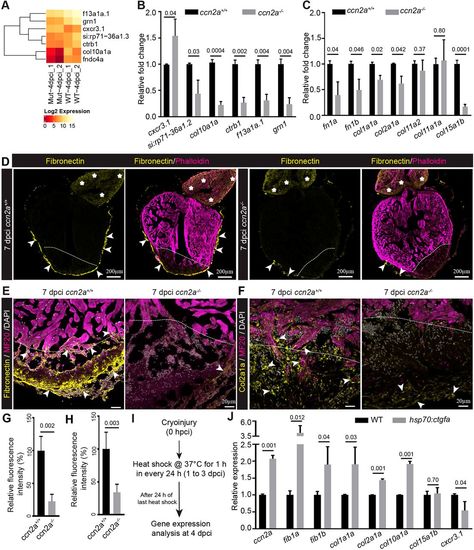
Ccn2a regulates secreted protein gene expression in injured heart. (A) Heat map with color key showing changes in gene expression between ccn2a mutant (Mut) and wild-type (WT) hearts at 4 dpci based on RNA-sequencing analysis. (B) qPCR analysis to validate the RNA sequencing data (A) at 4 dpci (n=3, each sample is a pool of 6 hearts). (C) Quantification of fibronectin and collagen gene expression at 4 dpci (n=3, each sample is a pool of 6 hearts). (D) Sagittal cryosections of 7 dpci heart immunostained for fibronectin (yellow) and stained for F-actin (phalloidin; marks all cells). Arrows and asterisks indicate fibronectin localization in the ventricle and bulbus arteriosus, respectively. (E) Fibronectin and MF20 immunohistochemical staining of ventricular sagittal cryosection of 7 dpci heart. Arrowheads indicate fibronectin localization in the injured tissue. (F) Col2a1a and MF20 immunohistochemical staining of a ventricular sagittal cryosection of 7 dpci heart. Arrowheads indicate Col2a1a localization in the injured tissue. Dotted lines mark the injury border. (G,H) Quantification of the percent relative fluorescence intensity of fibronectin (G) and Col2a1a (H) in wild-type and ccn2a−/− heart sections (n=4). The heart section from each heart showing the highest fluorescence intensity for fibronectin or Col2a1a was considered for analysis, and the mean of the wild-type control value was set to 100%. (I) Schematic of the experimental protocol used to measure gene expression post-cryoinjury in wild-type and hsp70:ctgfa transgenic animals. After cryoinjury, animals were subjected to daily 1 h heat shocks for 3 days. RNA was isolated 24 h after the last heat shock. (J) Quantitative analysis of the expression of fib1a, fib1b, col1a1a, col2a1a, col10, col15a1b and cxcr3.1 in injured wild-type and ccn2a overexpressing (hsp70:ctgfa) hearts at 4 dpci (n=3, each sample represents a pool of six hearts). Data are mean±s.d. Values in B,C and J are normalized to the mean of the control. The statistical significance of differences was evaluated using a two-tailed Student's t-test (GraphPad Prism). The thickness of each maximum projection is 10-12 µm. Mean Ct values for this figure are provided in Table S4. |
|
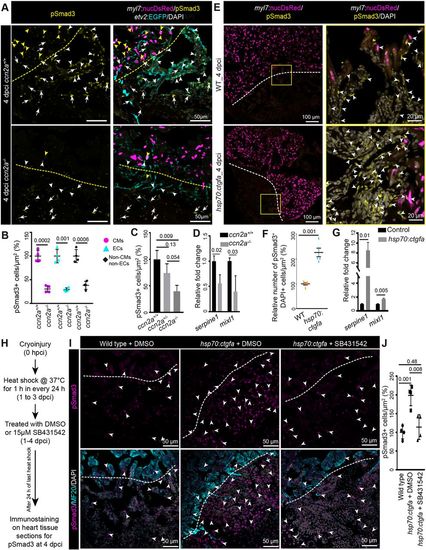
Ccn2a levels positively modulate nuclear pSmad3 localization in injured hearts. (A) Maximum intensity projections of confocal images of sagittal cryosections of 4 dpci hearts expressing DsRed in CM nuclei (magenta) and EGFP in endocardial/endothelial cells (cyan), immunostained for pSmad3 (yellow) and stained with DAPI (white; marks all nuclei). Yellow and white arrowheads indicate DsRed+/pSmad3+ and EGFP+/pSmad3+ cells, respectively. White arrows indicate cells that are DAPI+/pSmad3+ but DsRed− and EGFP−. Dotted lines indicate the wound edge. (B) Percentage of Tgfβ activity quantified in ccn2a+/+ and ccn2a−/− hearts (n=4). The graph represents the ratio of nuclear DsRed+/pSmad3+ CMs to the total number of nuclear DsRed+ CMs in the border zone (CMs); the ratio of EGFP+/pSmad3+ cells to the total number of EGFP+ endocardial/endothelial cells in the injured tissue (ECs); and the ratio of pSmad3+/DAPI+ cells to the total number of EGFP- and DsRed- cells per unit area in the injured tissue (non-CMs and non-ECs). The mean wild-type control value was set to 100%. Quantifications were performed on two sagittal sections from each heart. (C) Percentage of Tgfβ activity quantified in ccn2a+/+, ccn2a+/− and ccn2a−/− hearts at 4 dpci (n=3). The graph represents the ratio of pSmad3+/DAPI+ nuclei to the total number DAPI+ nuclei in the injured tissue. The mean wild-type control value was set to 100%. Quantifications were performed on two sagittal sections from each heart. (D) qPCR analysis of serpine1 and mixl1 expression at 4 dpci (n=3, each sample is a pool of six hearts). (E) Maximum intensity projection of confocal images of sagittal cryosection through 4 dpci wild-type and ccn2a-overexpressing (hsp70:ctgfa) heart expressing DsRed in CM nuclei (magenta), immunostained for pSmad3 (yellow) and stained with DAPI (white; marks all nuclei). Arrowheads indicate pSmad3+/DAPI+ cells. Dotted lines indicate the wound edge. (F) Nuclear pSmad3+ cells in the injured tissue quantified in wild-type and ccn2a-overexpressing (hsp70:ctgfa) heart (n=5 each). Two sagittal heart sections from each heart were considered for quantification. The mean wild-type control value was set to 100%. (G) qPCR analysis of serpine1 and mixl1 expression at 4 dpci (n=3, each sample is a pool of four hearts). (H) Schematic of the experimental procedures used in I and J. (I) Maximum intensity projection of optical sections of sagittal cryosections through 4 dpci wild-type heart and DMSO or SB431542 treated ccn2a-overexpressing (hsp70:ctgfa) heart, immunostained for pSmad3 (magenta) and with MF20 (cyan), and stained with DAPI (white; marks all nuclei). Arrowheads indicate pSmad3+/DAPI+ cells. Dotted lines indicate the wound edge. (J) Percentage of Tgfβ activity quantified in wild-type, and in DMSO or SB431542-treated ccn2a-overexpressing hearts at 4 dpci (n=4). The graph represents the ratio of pSmad3+/DAPI+ nuclei to the total number DAPI+ nuclei in the injured tissue. The mean wild-type control value was set to 100%. Quantifications were performed on two sagittal sections from each heart. Data are mean±s.d. A two-tailed Student's t-test was used to evaluate the statistical significance of the differences (GraphPad Prism). Thickness of the each maximum projection is 10-12 µm. Mean Ct values are provided in Table S4. |
|
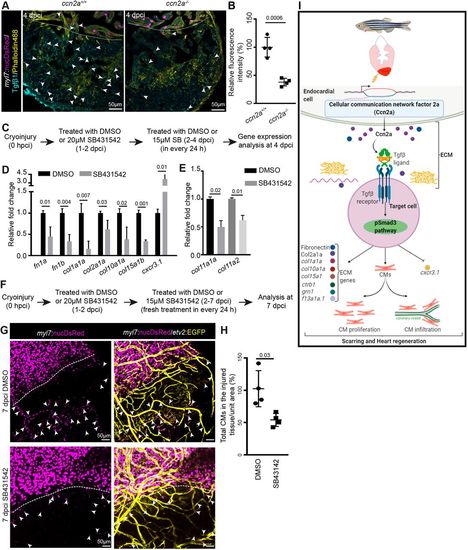
Decreased Tgfβ1 expression is observed in injured ccn2a mutant heart and Tgfβ/pSmad3 inhibition recapitulates the genetic regulation by ccn2a in injured heart. (A) Maximum intensity projection of confocal images of 10 μm sagittal cryosection of wild-type and ccn2a−/− heart at 4 dpci, expressing DsRed in CM nuclei (magenta), immunostained for Tgfβ1 (cyan) and stained for F-actin (yellow; marks all cells). Arrowheads indicate Tgfβ1 expression. Dotted lines mark the injury edge. (B) Percentage of relative fluorescence intensity of Tgfβ1 (n=4 each). The heart section from each heart showing the highest fluorescence intensity for Tgfβ1 was considered for quantification, and the mean of the wild-type control value was set to 100%. (C) Schematic of the experimental procedures used in D,E. (D,E) qPCR-based quantification of gene expression from DMSO- or SB431542 (TGFβ type I receptor inhibitor)-treated animals at 4 dpci (n=3, each sample is a pool of six hearts). The mean value of the DMSO-treated control for each gene was set to 1. (F) Schematic of the experimental procedures used in G,H. (G) Maximum intensity projections of confocal images of 7 dpci whole-mount heart expressing DsRed in CM nuclei and EGFP in endothelial/endocardial cells. Arrowheads indicate infiltrated CMs in the injured tissue. Dotted lines indicate the injury edge. (H) Analysis of infiltrated CMs in injured cardiac tissue quantified four DMSO-treated and four SB431542-treated wild-type animals from two independent experiments. The mean of the DMSO-treated control value was set to 100%. Data are mean±s.d. (I) Model of the regulatory role of Ccn2a in heart regeneration. CM, cardiomyocyte; ECM, extracellular matrix. The statistical significance of differences was evaluated by a two-tailed Student's t-test (GraphPad Prism). Mean Ct values are provided in Table S4. |

