FIGURE SUMMARY
Title

PCM1 is necessary for focal ciliary integrity and is a candidate for severe schizophrenia

Authors
Monroe, T.O., Garrett, M.E., Kousi, M., Rodriguiz, R.M., Moon, S., Bai, Y., Brodar, S.C., Soldano, K.L., Savage, J., Hansen, T.F., Muzny, D.M., Gibbs, R.A., Barak, L., Sullivan, P.F., Ashley-Koch, A.E., Sawa, A., Wetsel, W.C., Werge, T., Katsanis, N.
Source
Full text @ Nat. Commun.

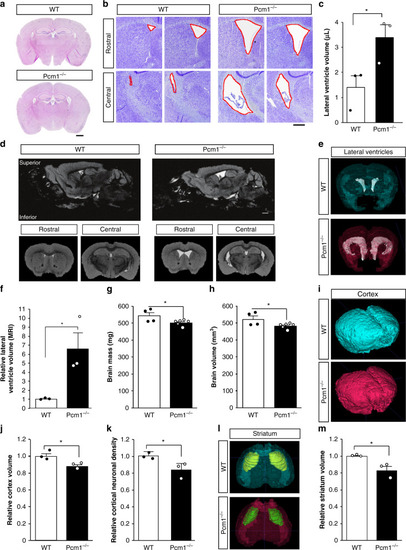
Neuroanatomical defects in adult <italic>Pcm1</italic><sup><italic>−/−</italic></sup> mice.

a Representative H&E sections from control and Pcm1−/− brains. Scale 1 mm (b) Representative Cresyl violet histological sections from two WT and two Pcm1−/− brains depicting enlarged ventricles in the mutant. c Lateral ventricle volume by stereology (N = 3; p = 0.047). Scale 0.4 mm (d) Representative slices from adult WT and Pcm1−/− brain MRIs. Scale 0.6 mm (e) Representative volumetric views of the lateral ventricles. f Lateral ventricle volume (N = 3; p = 0.036). g Total brain size (N = 4 and 6); p = 0.05). h Total brain volume (N = 4 and 6; p = 0.05). i Representative volumetric views of the cortex. j Cortex volume (N = 3; p = 0.035). k Cortical neuron density (N = 4; p = 0.045). l Representative volumetric views of the striatum (anterior view, shown with transparent cortex). m Striatal volume (N = 3; p = 0.027). Data presented as mean ± SEM; *p < 0.05, WT vs. Pcm1−/−. Two-sided t-tests, without adjustments. Source data and detailed statistical information are provided as a Source Data File.

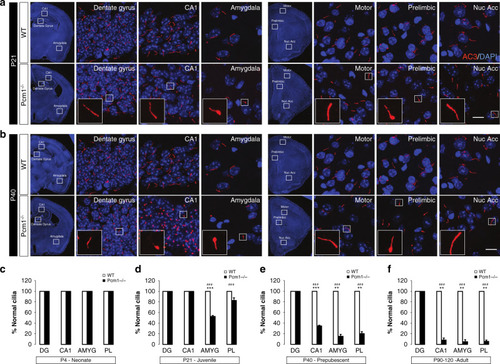
Temporal and spatial ciliary abnormalities at different ages.

a Coronal brain images revealing bulbous cilia in the prelimbic cortex and amygdala of P21 Pcm1−/− mice. Scale 5 µm (b) At P40, brain regions in the Pcm1−/− mice showing an increased frequency of bulbous cilia. Scale 5 µm (cf) Bar graphs showing the proportion of normal cilia in various brain regions from P4 (c), P21 (d), P40 (e), and P90 (f) in WT and Pcm1−/− mice (cf; N > 30 cilia/region/mouse, 3 mice/genotype; t-test p < 0.001 P21 AMYG; p < 0.001 P21 CA1; p = 0.004 P40 AMYG; p = 0.005 P40 PL; p = 0.004 P90 CA1; p = 0.003 P90 AMYG; p = 0.0012 P90 PL). DG dentate gyrus, AMY amygdala, PL prelimbic cortex. χ2 test, ###p < 0.001; t-tests, mean ± SEM **p < 0.01, ***p < 0.001, WT vs. Pcm1−/−. Source data and detailed statistical information are provided as a Source Data File.

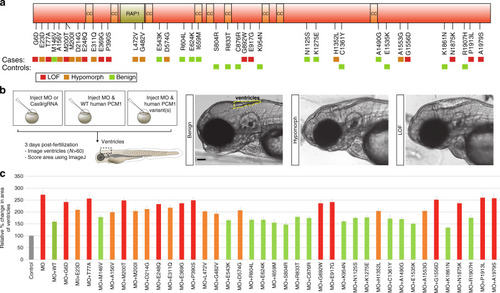
Enrichment of rare, pathogenic <italic>PCM1</italic> mutations in ASZ and functional modeling.

a Schematic depicting PCM1 protein and the location of protein interaction domains, and ultra-rare non-synonymous changes identified in both severe SZ cases and controls from the discovery and replication cohort. Colored boxes indicate loss of function (LOF), hypomorphic, or benign results from functional modeling in the zebrafish. b Schematic showing the functional modeling procedure in zebrafish embryos. 3 dpf, embryos imaged and ventricles quantified using ImageJ. Representative images for benign, hypomorphic, and LOF alleles are presented. Scale 100 µm (c) Normalized values for the average ventricular area of each variant discovered from severe SZ cases and controls are plotted relative to MO and MO + WT conditions. N fish/variant shown in Supplementary Table 1 with p values. Data as mean ± SD. LOF loss of function, CC coiled-coils domain, RAP1 rhoptry-associated protein 1 sequence, CI confidence interval, MO morpholino, WT wild-type. Detailed statistics in Table 1. Source data are provided as a Source Data File. Illustrations are original.

PHENOTYPE:
Fish:
Knockdown Reagents:
Observed In:
Stage: Protruding-mouth

ZFIN is incorporating published figure images and captions as part of an ongoing project. Figures from some publications have not yet been curated, or are not available for display because of copyright restrictions.

Acknowledgments
This image is the copyrighted work of the attributed author or publisher, and ZFIN has permission only to display this image to its users. Additional permissions should be obtained from the applicable author or publisher of the image. Full text @ Nat. Commun.