FIGURE SUMMARY
Title

Loss of CBY1 results in a ciliopathy characterized by features of Joubert syndrome

Authors
Epting, D., Senaratne, L.D.S., Ott, E., Holmgren, A., Sumathipala, D., Larsen, S.M., Wallmeier, J., Bracht, D., Frikstad, K.M., Crowley, S., Sikiric, A., Barøy, T., Käsmann-Kellner, B., Decker, E., Decker, C., Bachmann, N., Patzke, S., Phelps, I.G., Katsanis, N., Giles, R., Schmidts, M., Zucknick, M., Lienkamp, S.S., Omran, H., Davis, E.E., Doherty, D., Strømme, P., Frengen, E., Bergmann, C., Misceo, D.
Source
Full text @ Hum. Mutat.

ZFIN is incorporating published figure images and captions as part of an ongoing project. Figures from some publications have not yet been curated, or are not available for display because of copyright restrictions.

EXPRESSION / LABELING:
Antibody:
Fish:
Knockdown Reagents:
Anatomical Term:
Stage: Prim-5
PHENOTYPE:
Fish:
Knockdown Reagents:
Observed In:
Stage: Prim-5

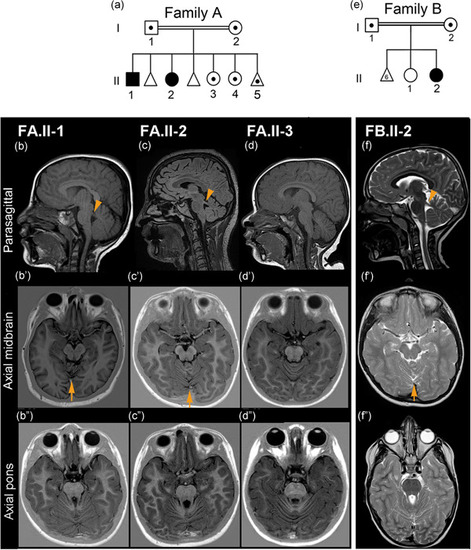
Pedigree of Families A and B and cerebral MRI findings. (a) Pedigree of Family A showing the two affected siblings (black symbols) and carriers (symbols with the dot) of the CBY1 variant Chr22:g.39067079_39067080del within the family. The first two fetuses were not genotyped. (b−f) Cerebral magnetic resonance imaging examinations in Family A (FA.II‐1, FA.II‐2, FA.II‐3), and Family B (FB.II‐2). In the parasagittal views (b,c,f), the superior cerebellar peduncles (arrowheads) are more horizontally oriented, as opposed to the normal and more vertically oriented peduncle in (d). In the axial midbrain views (bʹ,cʹ,fʹ), cerebellar vermian foliar dysplasia is seen above the arrows. This anomaly is not present in (dʹ). The axial pons views (b″,c″,f″) show elongation of the superior cerebellar peduncles giving a mild “molar tooth” appearance, but not in (d″). Sagittal views (b–d) are T1 and (f) T2 weighted. Axial midbrain and pons views (bʹ–dʹ) and (b″–d″) are inversion recovery and (f–f″) are T2 weighted. (e) Pedigree of Family B showing the affected sibling and her parents, which are carriers of the CBY1 variant Chr22:g.39064123_39064124dup. FB.II‐1 and the fetuses were not genotyped

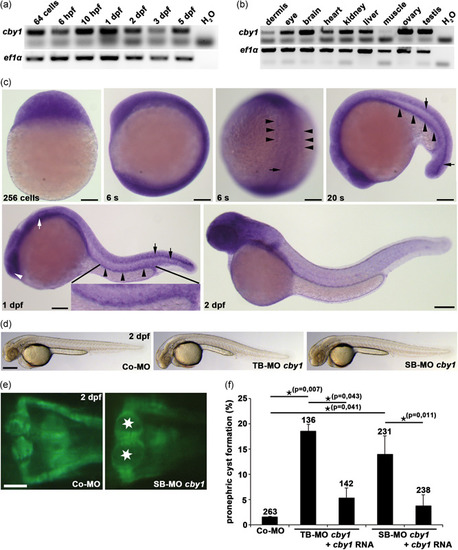
Zebrafish studies showing temporal and spatial expression of
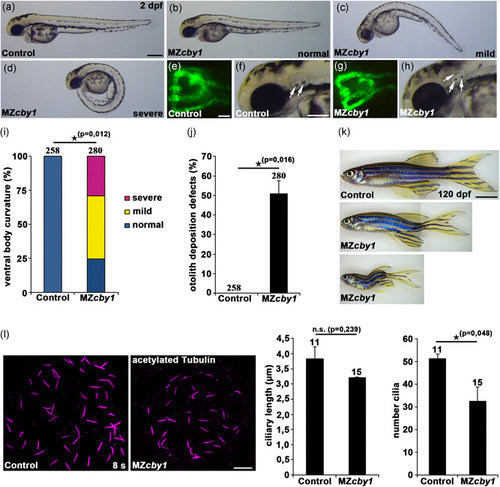
 cby1 and evidence of a ciliopathy phenotype after cby1 knockdown. (a) Semiquantitative reverse‐transcription polymerase chain reaction (RT‐PCR) analysis reveals maternal expression of cby1 at the 64‐cell stage and expression of cby1 throughout embryogenesis. ef1α served as a loading control. (b) Semiquantitative RT‐PCR analysis reveals expression of cby1 in most adult zebrafish organs analyzed, with prominent expression in eye, brain, kidney, liver, ovary, and testis. ef1α served as a loading control. (c) Whole mount in situ hybridization analysis for cby1 in zebrafish. Maternal cby1 transcripts are ubiquitously distributed at the 256‐cell stage. Broad expression of cby1 at six‐somite stage (6s) with specific expression in axial mesoderm (black arrow) and pronephric mesoderm (black arrowheads). At 20‐somite stage (20s), cby1 shows expression in the developing pronephric tubule (black arrowheads) and ventral spinal cord (black arrows). At 1 day post‐fertilization (1 dpf), expression of cby1 is detected in ciliated organs including the nasal placode (white arrowhead), otic vesicle (white arrow), neural tube (black arrows), and pronephric tubule (black arrowheads). At 2 dpf, cby1 has a broad expression in the head. Scale bars = 100 µm. (d) Brightfield images showing overall morphology of 2dpf zebrafish embryos injected with control morpholino (Co‐MO), translation‐blocking morpholino (TB‐MO) cby1, and splicing‐blocking morpholino (SB‐MO) cby1. Scale bar = 100 µm. (e) Knockdown of cby1 results in pronephric cyst formation (stars), as shown in a dorsal view with anterior to the top of a Tg(wt1b:EGFP) zebrafish embryo at 2 dpf. Scale bar = 5 µm. (f) Quantification of pronephric cyst formation in 2dpf zebrafish embryos injected with Co‐MO, TB‐MO cby1, TB‐MO cby1 + cby1 mRNA, SB‐MO cby1, and SB‐MO cby1 + cby1 mRNA. There was significant prevention of pronephric cyst formation upon coinjection of cby1 mRNA. The number of individual embryos analyzed is indicated above each bar

Zebrafish cby1 knockout mutants display ciliopathy‐related phenotypes. (a–h) Images of maternal‐zygotic (MZ) cby1 mutant embryos at 2 dpf display no or different degrees of ventral body curvature defects (b–d), no pronephric cyst formation as shown in a dorsal view with anterior to the top of a Tg(wt1b:EGFP) zebrafish embryo at 2 dpf (g), and prominent otolith deposition defects (white arrows) at 2 dpf (h) in comparison to the respective controls (a,e,f). Scale bars = 100 µm (a), 5 µm (e), and 50 µm (f). (i) Quantification of different degrees of ventral body curvature of 2dpf MZcby1 mutant embryos in comparison to the respective control. The number of individual embryos analyzed is indicated above each bar. (j) Quantification of otolith deposition defects of 2dpf MZcby1 mutant embryos in comparison to the respective control. The number of individual embryos analyzed is indicated above each bar. (k) Brightfield images of adult MZcby1 mutants at 120 dpf in comparison to the respective control. Scale bar = 500 µm. (l) Confocal images of the Kupffer's vesicle of control and MZcby1 mutant embryos at the stage of 8 somites (8s). Cilia were visualized by acetylated tubulin staining and ciliary length and number of cilia were quantified. Scale bar = 10 µm

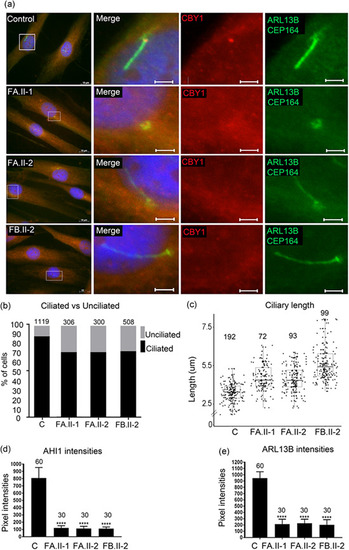
Reduced fraction of ciliated cells and increased primary cilia length in fibroblasts from patients. (a) Fibroblasts from two controls (images from one control shown) and from the individuals FA.II‐1, FA.II‐2, FB.II‐2 were fixed after 72 h of serum starvation and stained for ARL13B and CEP164 (Alexa488, green), CBY1 (Cy3, red), and nuclei (Hoechst, blue). The CBY1 signal was detected at the transition zone in the control, but not in cells from FA.II‐1, FA.II‐2, FB.II‐2. Scale bars are 10 µm in the left panel and 2 µm in the magnified pictures. (b) Fibroblasts from two controls and from the affected individuals FA.II‐1, FA.II‐2, FB.II‐2 were fixed after 72h serum starvation and stained for acetylated tubulin, CEP164, and nuclei (Hoechst). The numbers of ciliated fibroblasts were significantly reduced in FA.II‐1, FA.II‐2, and FB.II‐2 (p < .0001) compared with the two pooled controls (C in the figure). The numbers of cells analyzed are indicated on top of the bars. (c) Staining for ARL13B and polyglutamylated tubulin and nuclei (Hoechst) detected a significant increase in ciliary length in serum‐starved fibroblasts from the affected individuals FA.II‐1, FA.II‐2, FB.II‐2 compared with the two pooled controls (C). Median length difference between cilia in cells from affected individuals and control cells were 0.44, 0.43, and 1.65 µm, respectively (p < .0001). The numbers of cells analyzed are indicated on top. (d) Intensity measurement for AHI1 costained with polyglutamylated tubulin and Hoechst detected significantly reduced AHI1 signal intensities in serum‐starved fibroblasts from FA.II‐1, FA.II‐2, and FB.II‐2 compared with the two pooled controls (C) (p < .0001). The numbers of cilia analyzed are indicated on top of the bars. (e) Intensity measurements for ARL13B costained with polyglutamylated tubulin and Hoechst detected significantly reduced ARL13B signal intensities in serum‐starved fibroblasts from FA.II‐1, FA.II‐2, and FB.II‐2 compared with the two pooled controls (C) (p < .0001). The numbers of cilia analyzed are indicated on top of the bars

Acknowledgments
This image is the copyrighted work of the attributed author or publisher, and ZFIN has permission only to display this image to its users. Additional permissions should be obtained from the applicable author or publisher of the image. Full text @ Hum. Mutat.