FIGURE SUMMARY
Title

A zebrafish functional genomics model to investigate the role of human A20 variants in vivo

Authors
Cultrone, D., Zammit, N.W., Self, E., Postert, B., Han, J.Z.R., Bailey, J., Warren, J., Croucher, D.R., Kikuchi, K., Bogdanovic, O., Chtanova, T., Hesselson, D., Grey, S.T.
Source
Full text @ Sci. Rep.

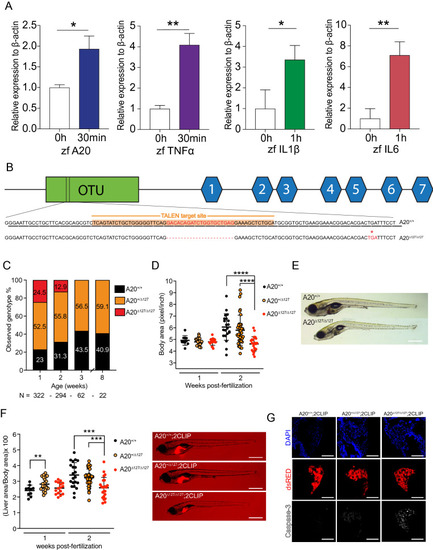
A20-deficient zebrafish fail to thrive. (A) Peak induction of inflammatory genes, and relative p-values. *P < 0.05, **P < 0.01. (B) Gene targeting of A20 highlighting the 20 bp deletion and predicted stop codon at amino acid 127, previously a Leucine. (C) Percentages of surviving A20+/+, A20+/∆127 and A20∆127/∆127 zebrafish at 1, 2, 3 and 8wpf, generated from N = 15 A20+/∆127 crosses. (D) Body area measured in (pixel/inch) per zebrafish genotype at 1 and 2 wpf. Each dot represents an individual zebrafish. Data represented as mean ± SD, P-values were determined using 1way ANOVA. ****P < 0.0001. Each group passed the normality test. (E) Representative brightfield image of one A20+/+ (top) and A20∆127/∆127 (bottom) zebrafish at 2 wpf. Scale bar represent 2 mm. (F) Liver to body ratios measured in (pixel/inch) per zebrafish genotype at 1 and 2 wpf. Each dot represents an individual zebrafish. Data represented as mean ± SD, P-values were determined using 1way ANOVA. **P < 0.01, ****P < 0.0001. Each group passed the normality test. For each genotype a representative A20+/+, A20+/∆127 and A20∆127/∆127 2 wpf zebrafish is shown. The scale bars represent 2 mm. (G) Immuno-fluorescence sections of livers from 2CLIP reporter fish for the A20 genotypes. The scale bars represent 300 μm. Software used for this Figure: GraphPad Prism v7.0 (https://www.graphpad.com/scientific-software/prism/), Adobe Illustrator CC 2018 (https://www.adobe.com/au/products/illustrator.html), Leica LAS X (https://www.leica-microsystems.com/products/microscope-software/p/leica-application-suite/), IMARIS Image Analysis Software v8 (BITPLANE, Switzerland) (https://imaris.oxinst.com/).

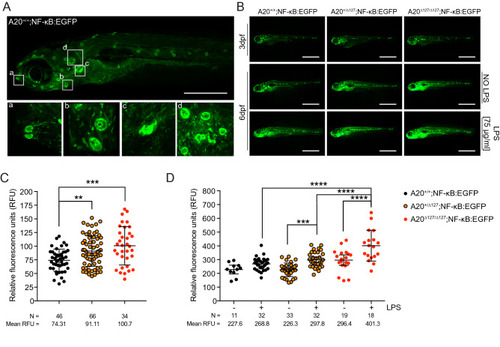
A20 is necessary to maintain inflammatory homeostasis in zebrafish. (A) Representative fluorescent image of a NF-κB:EGFP zebrafish at 6 dpf showing spontaneous NF-κB activity (fluorescence) in the (a) mouth, (b) lateral neuronmasts, (c) pharyngeal tooth, and (d) gills. Scale bar represents 2 mm. (B) Representative fluorescent images of NF-κB:EGFP zebrafish of different A20 genotypes at 3 and 6 dpf ± LPS. The scale bars represent 1 mm. (C, D) Cumulative data of relative fluorescence units of NF-κB:EGFP zebrafish by A20 genotype at; 3 dpf without LPS stimulation and 6 dpf ± LPS. Each dot represents an individual fish. Data are representative of N = 10 crosses. N per group and mean values reported below each graph. Data represented as mean ± SD, P-values were determined using 1-way ANOVA. Each group passed the normality test. **P < 0.01, ***P < 0.001, ****P < 0.0001. Software used for this Figure: GraphPad Prism v7.0 (https://www.graphpad.com/scientific-software/prism/), Adobe Illustrator CC 2018 (https://www.adobe.com/au/products/illustrator.html), Leica LAS X (https://www.leica-microsystems.com/products/microscope-software/p/leica-application-suite/).

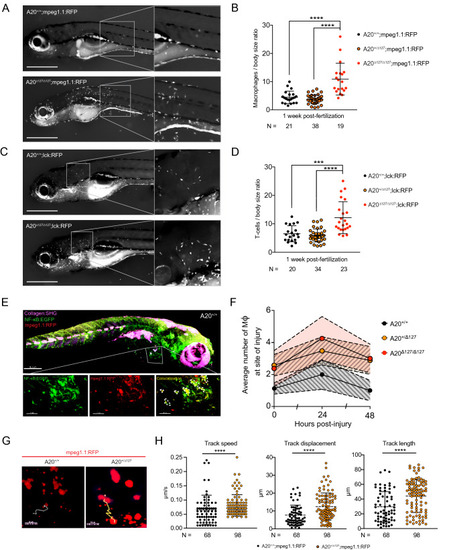
Impact of A20 deletion on macrophage activity in zebrafish. (A) Representative fluorescent image of A20+/+;mpeg1.1:RFP (top) and A20∆127/∆127;mpeg1.1:RFP (bottom) zebrafish at 1 wpf. (B) Number of macrophages counted from images of zebrafish by A20 genotype as in (A). Data represented as mean ± SD, P-values were determined using Whelch’s t-test. ****P < 0.0001. (C) Representative fluorescent image of A20+/+;lck:RFP (top) and A20∆127/∆127;lck:RFP (bottom) zebrafish at 1 wpf. (D) Number of dermal T lymphocytes counted from images of zebrafish by A20 genotype as in (C). Data represented as mean ± SD, P-values were determined using Whelch’s t-test. ***P < 0.001, ****P < 0.0001. (E) 3-D rendering of a Two-Photon microscope tilemap of a double-reporter (NF-κB:EGFP;mpeg1.1:RFP) A20+/+ zebrafish. The image shows three channels: Collagen (in magenta) generated through Second Harmonic, NF-κB (in green) generated though EGFP fluorescence and mpeg1.1 (in red) generated through RFP fluorescence. The accompanying video (Supplementary Video S3) navigates through the 3D rendering. IMARIS Image Analysis Software v8 (BITPLANE, Switzerland) (https://imaris.oxinst.com/). (F) Average number of macrophages at the site of injury measured at 24 and 48 h post-injury. Error bands are SEM. Area under the curve at 24 hpi was significant for A20+/+ x A20+/∆127 (*p < 0.05) and A20+/+ x A20∆127/∆127 (*p < 0.05). (G) Screenshots of a Two-Photon z-stack 15 min time-lapse track path of an A20+/+;mpeg1.1:RFP and A20∆127/∆127;mpeg1.1:RFP zebrafish in the resting state. The tracks show the path taken by a representative macrophage expressing RFP. The chosen macrophages are the closest to the average tracking data. (H) Macrophages from mpeg1.1:RFP positive zebrafish were imaged using in vivo two-photon microscopy and their track speed, track displacement and track length were quantified and used to determine a ‘meandering index’. Data collected from 4 A20+/+ and 3 A20+/∆127 comprising of 68 and 98 macrophages tracks respectively. Data represented as mean ± SD, P-values were determined using Mann–Whitney t-test. ****P < 0.0001. Software used for this Figure: GraphPad Prism v7.0 (https://www.graphpad.com/scientific-software/prism/), Adobe Illustrator CC 2018 (https://www.adobe.com/au/products/illustrator.html), Leica LAS X (https://www.leica-microsystems.com/products/microscope-software/p/leica-application-suite/), IMARIS Image Analysis Software v8 (BITPLANE, Switzerland) (https://imaris.oxinst.com/).

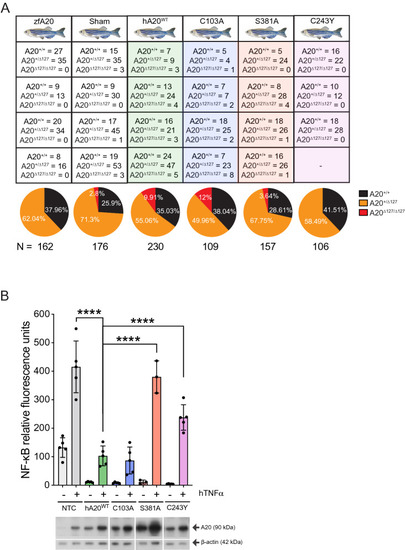
The impact of human A20 mutants on A20∆127/∆127 zebrafish survival. (A) Survival data for A20+/+, A20+/∆127 and A20∆127/∆127 zebrafish at 3 wpf (zfA20), mock injected (Sham) or with ectopic administration of wild-type human A20 (hA20WT), C103A, S381A or C243Y mutants. Numbers indicate number of genotyped survivors expressing the respective human gene variant. Each box indicates the survivors from an independent experiment. Survival frequency data is represented in the pie chart. N indicates the total number of zebrafish embryos injected for each A20 mutant. Statistical difference was observed between zfA20 and C103A injected/rescued fish (*p < 0.05) and between C103A and C243Y injected fish (*p < 0.05). (B) NF-κB luciferase assay for HEK293 cells transiently non-transfected (NTC), or co-transfected with wild-type human A20 (hA20WT) or the C103A, S381A or C243Y mutant and treated with or without hTNFα. Data represented as mean ± SD. P-values were determined using ANOVA. Each dot represents an individual experiment and are representative of N = 3–5 experiments per A20 mutant. Below is shown a representative Western blot for each A20 mutant. The displayed gel has been cropped to improve clarity and conciseness of the figure. Software used for this Figure: GraphPad Prism v7.0 (https://www.graphpad.com/scientific-software/prism/), Adobe Illustrator CC 2018 (https://www.adobe.com/au/products/illustrator.html), Bio-rad ChemiDoc v6 (https://www.bio-rad.com/en-au/product/chemidoc-imaging-system?ID=OI91XQ15).

Acknowledgments
This image is the copyrighted work of the attributed author or publisher, and ZFIN has permission only to display this image to its users. Additional permissions should be obtained from the applicable author or publisher of the image. Full text @ Sci. Rep.