
- Title
-
Daily mitochondrial dynamics in cone photoreceptors
- Authors
- Giarmarco, M.M., Brock, D.C., Robbings, B.M., Cleghorn, W.M., Tsantilas, K.A., Kuch, K.C., Ge, W., Rutter, K.M., Parker, E.D., Hurley, J.B., Brockerhoff, S.E.
- Source
- Full text @ Proc. Natl. Acad. Sci. USA
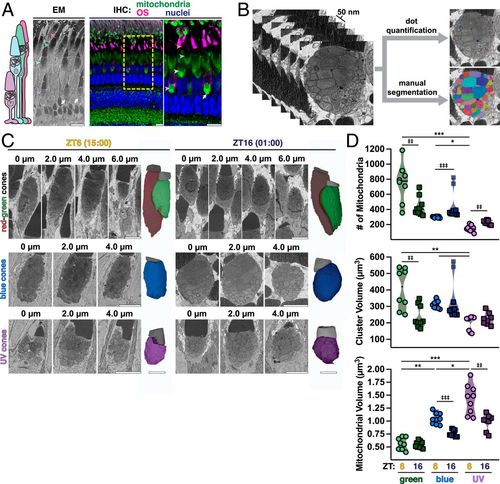
At night single cones have more small mitochondria. (A) Schematic of zebrafish cone subtypes (Left), with EM (Middle) and IHC (Right) images of zebrafish outer retina. IHC images are stained for all mitochondria (green), red-green cone OSs (magenta), and nuclei (blue). Arrowheads indicate corresponding UV, blue, green, and red cone mitochondrial clusters; white arrows, megamitochondria at UV cluster bases. Yellow box, zoomed-in area. (Scale bars, 10 µm.) (B) Example 50-nm Z-stack from SBFSEM used for 3D analysis via manual segmentation or rapid dot quantification. (C) Z-stacks from SBFSEM with 3D-rendered mitochondrial clusters (colored) and OSs (gray) from green, blue, and UV cone subtypes in daytime at ZT6 (15:00) and night at ZT16 (01:00). (Scale bars, 5 µm.) (D) Violin plots of mitochondrial number, cluster volume, and mitochondrial volume from dot quantification and manual segmentation; lines represent median. Cone subtypes are represented by respective colors at ZT6 (circles) and ZT16 (squares). *,‡P < 0.05. **, ‡‡P < 0.01. ***,‡‡‡P < 0.001. SI Appendix, Table S2 lists statistical information and Ns from each group. PHENOTYPE:
|
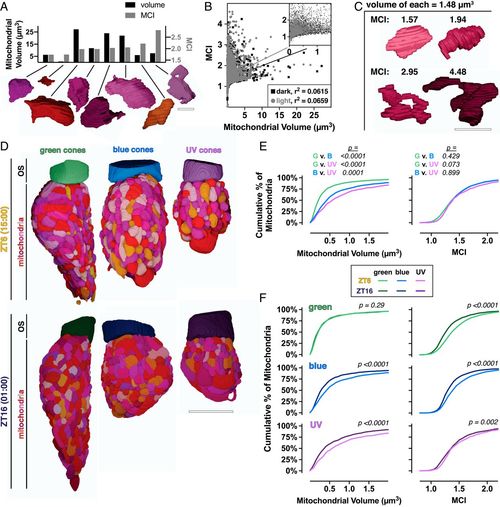
At night cones have more simple mitochondria. (A) Three-dimensional renderings of eight manually segmented cone mitochondria with corresponding quantifications of volume (Left axis, black bars) and MCI (Right axis, gray bars). (Scale bar, 2 µm.) (B) Cross-correlation plot of mitochondrial volume and MCI for individual mitochondria at ZT16 (black squares) and ZT6 (gray circles). (C) Three-dimensional renderings of single mitochondria with equal volumes (1.48 µm3) over a range of MCIs. (Scale bar, 2 µm.) (D) Three-dimensional renderings from manual segmentation of mitochondria and OSs in green, blue, and UV cones at ZT6 and ZT16. (Scale bar, 5 µm.) (E) Cumulative frequency distributions for mitochondrial volume and MCI comparing mitochondria between cone subtypes at ZT6. (F) Cumulative frequency distributions for cone subtypes, comparing mitochondrial volume and MCI at ZT6 (light lines) and ZT16 (dark lines). ZT6 curves are also presented in E; SI Appendix, Table S2 lists Ns from all groups. PHENOTYPE:
|
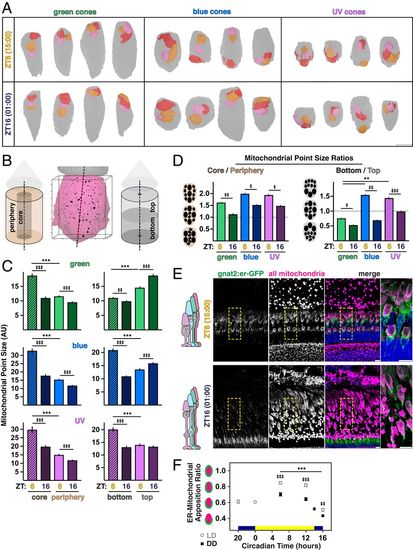
Distribution of mitochondrial size across the cluster changes throughout the day. (A) Three-dimensional renderings of the three largest mitochondria in manually segmented cones at ZT6 and ZT16. OSs are oriented toward the top; ellipsoids, gray. Largest mitochondrion, red; middle, orange and smallest, pink. (Scale bar, 5 µm.) (B) Three-dimensional rendering of cone ellipsoid (magenta) and OS (gray) overlaid with the corresponding point cloud. Individual mitochondria are represented at their X-Y-Z locations; point size corresponds to relative mitochondrial size. Points were separated into core and peripheral or top and bottom populations. Axis ticks, 1 µm. (C) Quantification of mean mitochondrial point size in regions of the cluster for cone subtypes at ZT6 and ZT16. (D) Mitochondrial point size ratios quantifying regional core–periphery and bottom–top distributions of mitochondrial size reported in C for cone subtypes at ZT6 and ZT16. In C and D, ‡P < 0.05; **P < 0.01; ‡‡P < 0.001; ***,‡‡‡P < 0.0001. (E) IHC images of transgenic zebrafish outer retina expressing cone-targeted er-GFP (green) overlaid with mitochondrial and nuclear stains (magenta and blue, respectively) at ZT6 and ZT16. Yellow boxes, zoomed-in areas. (Scale bars, 10 µm.) (F) Quantification of mean ER–mitochondrial apposition in blue and UV cones from IHC for LD or DD groups. ‡‡P < 0.01. ***,‡‡‡P < 0.0001. SI Appendix, Table S2 lists statistical information and Ns from all groups. |
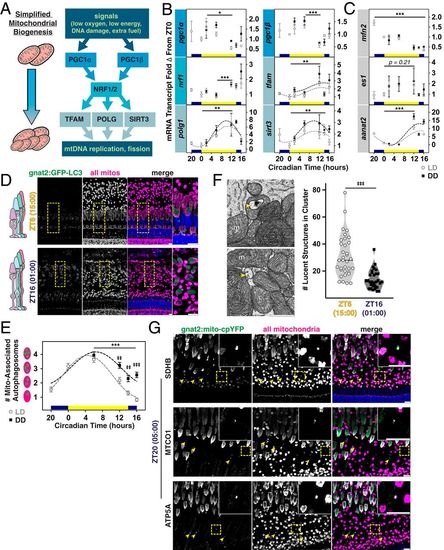
Mitogenesis genes peak in the evening, when fewer autophagosomes associate with mitochondrial clusters. (A) Simplified pathway for mitogenesis. (B and C) Quantification of mRNA transcripts from whole retinas measured using qPCR: in B, six mitogenesis genes, and in C, the mitochondrial fusion factor mfn2, the mitochondrial enlargement factor es1, and a control gene aanat2. LD, open circles; DD, black squares. *P < 0.05. **P < 0.01. ***P < 0.0001. (D) IHC images of transgenic zebrafish outer retina expressing cone-targeted GFP-LC3 (green) overlaid with mitochondrial and nuclear stains (magenta and blue, respectively) at ZT6 and ZT16. Yellow boxes, zoomed-in areas. (Scale bars, 10 µm.) (E) Quantification of mitochondrial LC3-positive puncta in blue and UV cones from IHC for LD or DD groups. ‡‡P < 0.001. ***,‡‡‡P < 0.0001. (F, Left) SEM images of lucent autophagosomal structures (yellow arrowheads) inside and between cone mitochondria (m). (Scale bar, 1 µm.) (F, Right) Violin plots quantifying lucent structures in clusters at ZT6 (empty circles) and ZT16 (black squares); lines represent median. ‡‡‡P < 0.0001. (G) IHC images of transgenic cone-targeted mito-cpYFP (green) counterstained for SDHB, MTCO1, or ATP5A (magenta) and nuclei (blue) at 05:00 (ZT20). Yellow arrowheads and Insets indicate mislocalized mitochondria. (Scale bars, 10 µm.) SI Appendix, Table S2 lists statistical information and Ns from all groups. |
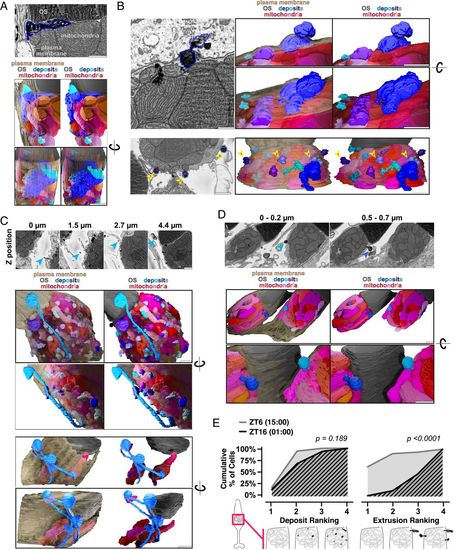
Mitochondria share material and extrude it from the cell in darkness. (A) SBFSEM image (Top) of deposits associated with cone mitochondria and corresponding 3D renderings (Bottom). One large deposit (blue outline) below the OS is associated with multiple mitochondria. (B) SBFSEM images showing extrusion of mitochondrial-associated deposits from cones, with 3D renderings. (B, Top) Extrusion of one deposit (blue outline). (B, Bottom) Multiple extrusion events in one cell (blue-violet outlines, yellow arrows). (C) SBFSEM images showing stalks and networks in the extracellular space, and corresponding 3D renderings. (C, Middle) One extruded deposit tethered to mitochondria by a stalk (blue arrows). (C, Bottom) Branched network of extruded material contacting three distinct populations of cone mitochondria from one cell. (D) Extrusion of mitochondrial-associated deposits from two neighboring rods. (D, Top) SBFSEM minimum intensity projections over 0.2-µm depth highlighting extrusion events (blue arrows). (D, Bottom) Three-dimensional rendering. (All scale bars, 1 µm.) Beige, plasma membrane; gray, OSs; reds, mitochondria; blues, deposits. (E) Quantification of deposits and extrusion events at ZT6 (gray) and ZT16 (black). For deposits: 1 (no mitochondrial deposits) to 4 (every mitochondrion having a deposit). For the number of extrusion events: 1 (no events) to 4 (more than three events). SI Appendix, Table S2 lists Ns from all groups. |
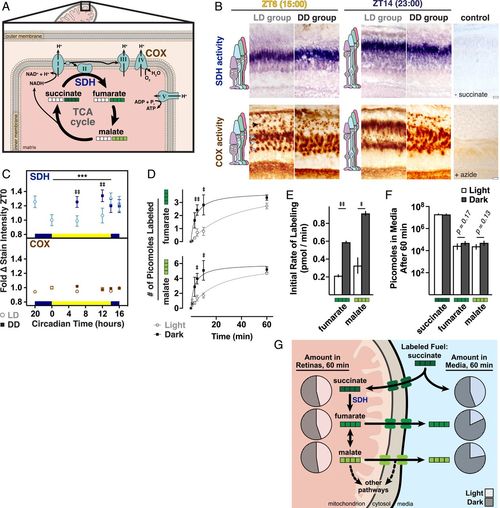
Mitochondrial metabolism is more active in darkness due to altered SDH activity. (A) Schematic of SDH in the tricarboxylic acid (TCA) cycle and electron transport chain, including COX also assayed in B. White squares represent 12C carbons; green squares,13C carbons for labeling experiments (D–F). (B) Light microscopy images of histochemical staining for SDH (blue) and COX (brown) activities. Shown are frozen sections from albino zebrafish at ZT6 and ZT14 (23:00) from LD and DD groups. Negative controls lacked substrate or contained an inhibitor. Arrowheads indicate corresponding cone subtype and rod (black) mitochondrial clusters. (Scale bars, 10 µm.) (C) Quantification of mean SDH and COX stain intensities in single clusters from LD (open circles) or DD (dark squares) groups; data normalized to ZT0. ‡‡P < 0.001. ***P < 0.0001. (D) Mean incorporation of 13C label from U-13C succinate into fumarate and malate. Whole retinas from light- or dark-adapted zebrafish were incubated in U-13C succinate in light or dark; 13C incorporation was determined with GC/MS. (E) Initial rates of formation of fumarate and malate from U-13C succinate in light and dark from the first 5 min of incubation. In D and E, ‡P < 0.05; ‡‡P < 0.001. (F) Amounts of U-13C-labeled succinate, fumarate, and malate in media after 60-min light or dark incubation with retinas in U-13C succinate. SI Appendix, Table S2 lists P values and Ns from all groups. (G) Schematic of steady-state metabolites inside and outside of retinas after 60-min incubation with labeled succinate. Pie charts denote relative amounts of metabolites in light (unfilled areas) and dark (filled areas). |