FIGURE SUMMARY
Title

Prevention of mitochondrial impairment by inhibition of protein phosphatase 1 activity in amyotrophic lateral sclerosis

Authors
Choi, S.Y., Lee, J.H., Chung, A.Y., Jo, Y., Shin, J.H., Park, H.C., Kim, H., Lopez-Gonzalez, R., Ryu, J.R., Sun, W.
Source
Full text @ Cell Death Dis.

Reduction of Drp1 S616 phosphorylation in the SOD1 G93A model.

a p-Drp1 S616 and Fis1 protein expression levels in the lumbar spinal cord of SOD1 G93A mice, and quantification of the relative expression of p-Drp1 S616 and Fis1, compared to WT. WT:p-DRPS616 = 1.00 ± 0.12 (n = 3 mice), G93A: p-DRPS616 = 0.64 ± 0.07 (n = 5 mice), WT:DRP1 = 1.00 ± 0.12 (n = 3 mice), G93A: DRP1 = 0.96 ± 0.06 (n = 5 mice), WT:Fis1 = 0.24 ± 0.07 (n = 3 mice), G93A: Fis1 = 0.70 ± 0.12 (n = 5 mice). Values are mean ± S.E.M. F(1,6) = 2.80, *P = 0.0311 for p-DRPS616; F(1,6) = 0.2721, P = 0.7946 for DRP1; F(1,6) = 2.691, *P = 0.0.0360 for Fis1 graph by two-sided Student’s t-test. n.s.: not significant. b p-Drp1 S616 immunostaining in the spinal MN of G93A and WT mice. The graph shows the ratio of intensity between p-Drp1 (green) and Drp1 (red) in ChAT-positive (blue; MN marker) neurons. WT = 1.56 ± 0.04 (n = 316 ChAT+ neurons), G93A = 0.81 ± 0.01 (n = 346 ChAT+ neurons. Values are mean ± S.E.M. F(1,660) = 18.4, ****P < 0.0001 by two-sided Student’s t-test. Scale bar, 100 μm. c Expression of p-Drp1 S616 in GFP-positive cortical neurons, following G93A or Q331K overexpression. The graph shows the quantification of p-Drp1 S616 intensity. Arrowhead indicates a GFP-positive neuron. GFP = 100.00 ± 8.40 (n = 24 GFP+ neurons), G93A = 45.30 ± 3.73 (n = 25 GFP+ neurons), Q331K = 42.95 ± 4.2 (n = 20 GFP+ neurons). Values are mean ± S.E.M. F(2,66) = 29.75, ****P < 0.0001 by one-way ANOVA with Tukey’s post hoc analysis for multiple comparisons. Scale bar, 20 μm.

Effects of the blockade of Drp1 activity on ALS mutant-induced pathological features.

Analysis of mitochondrial length ((a) N = 10 per group) and active caspase-3-positive neurons (bd) after 3 days following shRNA co-transfection or 25 μM Mdivi-1 treatment with G93A or Q331K clone. Mitochondrial images have been embossed. GFP = 100.1 ± 6.54 (n = 31 GFP+ neurons), SOD G93A:CON = 74.55 ± 6.54 (n = 24 GFP+ neurons), SOD G93A:shDRP1 = 197.3 ± 14.96 (n = 7 GFP+ neurons), SOD G93A:Mdivi = 105.5 ± 8.79 (n = 10 GFP+ neurons), SOD G93A:shFis1 = 143.7 ± 17.38 (n = 9 GFP+ neurons). Values are mean ± S.E.M. F(1,53) = 3.239, **P = 0.0021 for GFP versus SOD G93A:CON by two-sided Student’s t-test. F(3,46) = 33.54, *P = 0.0440, ****P < 0.0001 by one-way ANOVA with Tukey’s post hoc analysis for multiple comparisons in (a). GFP:CON = 100 ± 0.00 (n = 3 independent primary cultures), GFP:shDRP1 = 95.25 ± 36.86 (n = 3 independent primary cultures), G93A:CON = 218 ± 25.18 (n = 3 independent primary cultures), G93A:shDRP1 = 116.4 ± 7.52 (n = 3 independent primary cultures), Q331K:CON = 370 ± 38.99 (n = 3 independent primary cultures), Q331K:shDRP1 = 247.6 ± 18.38 (n = 3 independent primary cultures). Values are mean ± S.E.M. F(2,6) = 25.58, *P = 0.0473, ***P = 0.009 by one-way ANOVA with Tukey’s post hoc analysis for multiple comparisons. F(1,4) = 0.1289, P = 0.9037 for GFP:CON versus GFP:shDRP1; F(1,4) = 3.869, #P = 0.0180 for G93A:CON versus G93A:shDRP1; F(1,4) = 2.846, #P = 0.0466 for Q331K:CON versus Q331K:shDRP1 by two-sided Student’s t-test in (b). GFP:CON = 99.98 ± 0.03 (n = three independent primary cultures), GFP:Mdivi-1 = 86.85 ± 24.57 (n = 3 independent primary cultures), G93A:CON = 257 ± 15.85 (n = 3 independent primary cultures), G93A: Mdivi-1 = 119.9 ± 17.42 (n = 3 independent primary cultures), Q331K:CON = 372 ± 60.06 (n = 3 independent primary cultures), Q331K: Mdivi-1 = 171.9 ± 32.03 (n = 3 independent primary cultures). Values are mean ± S.E.M. F(2,6)=14.53, *P = 0.0483, **P = 0.0041 by one-way ANOVA with Tukey’s post hoc analysis for multiple comparisons. F(1,4) = 0.5345, P = 0.6213 for GFP:CON versus GFP:shDRP1; F(1,4) = 5.819, ##P = 0.0043 for G93A:CON versus G93A:shDRP1; F(1,4) = 2.922, #P =0 .0422 for Q331K:CON versus Q331K:shDRP1 by two-sided Student’s t-test in (c). GFP:CON = 100 ± 0.03 (n = 3 independent primary cultures), GFP:shFis1 = 94.73 ± 27.67 (n = 3 independent primary cultures), G93A:CON = 244 ± 4.88 (n = 3 independent primary cultures), G93A:shFis1 = 125.8 ± 36.28 (n = 3 independent primary cultures), Q331K:CON = 324.9 ± 18.34 (n = 3 independent primary cultures), Q331K: shFis1 = 146 ± 38.89 (n = 3 independent primary cultures). Values are mean ± S.E.M. F(2,6) = 108.1, ***P = 0.0002, ****P < 0.0001 by one-way ANOVA with Tukey’s post hoc analysis for multiple comparisons. F(1,4) = 0.1922, P = 0.8569 for GFP:CON versus GFP:shDRP1; F(1,4) = 3.24, #P = 0.0317 for G93A:CON versus G93A:shDRP1; F(1,4) = 2.922, #P = 0.0141 for Q331K:CON versus Q331K:shDRP1 by two-sided Student’s t-test in (d). Scale bar, 5 μm. e Zebrafish expressing G93A and Q331 with 2.5 μM Mdivi-1 daily treatment over 2 days, and the number of axonal defects of MNs counted for each of the four segments. Normal = 0.14 ± 0.1 (n = 14 zebrafish), G93A:CON = 2.93 ± 0.29 (n = 14 zebrafish), G93A:Mdivi-1 = 0.2 ± 0.2 (n = 5 zebrafish), Q331K:CON = 3.43 ± 0.33 (n = 14 zebrafish), Q331K:Mdivi-1 = 0.45 ± 0.28 (n = 11 zebrafish). Values are mean ± S.E.M. F(2,39) = 47.44, ****P < 0.0001 by one-way ANOVA with Tukey’s post hoc analysis for multiple comparisons.; F(1,17) = 5.445, ####P < 0.0001 for G93A:CON versus G93A:Mdivi-1, F(1,23) = 6.671, ####P < 0.0001 for Q331K:CON versus Q331K: Mdivi-1 by two-sided Student’s t-test.

Dephosphorylation of the site S616 of Drp1 by PP1 and the increase in PP1 activity in the lumbar spinal cord of G93A mice.

a Western blot analysis of p-Drp1 S616 and Drp1 expression level in primary cortical neuron with Cantharidin (for 1 h) or I-2 (for 1 day) treatment. b Representative immunostaining image of p-Drp1 S616 (red) in GFP+ primary cortical neuron with or without 80 nM I-2 treatment for 24 h. Arrowhead indicates the GFP-positive neuron. Scale bar, 20 μm. c PP1 activity in the lumbar spinal cord of G93A and WT mice at 60, 100, and 200 days of age. WT:Pre = 100 ± 7.79 (n = 3 mice), G93A:Pre = 125.9 ± 5.51 (n = 4 mice), WT:Onset = 100 ± 17.35 (n = 3 mice), G93A: Onset = 166 ± 14.32 (n = 5 mice), WT:Post = 100 ± 18.35 (n = 5 mice), G93A:Post = 148.7 ± 9.58 (n = 5 mice). Values are mean ± S.E.M. F(1,5) = 2.811, *P = 0.0375 for WT:Pre versus G93A:Pre; F(1,6) = 2.88, *P = 0.0281 for WT:Onset versus G93A:Onset; F(1,8) = .354, *P = 0.0464 for WT:Post versus G93A:Post by two-sided Student’s t-test. d Western blot analysis of p-PP1 and PP1 expression in the lumbar spinal cord of G93A and WT mice at the onset period. The graph shows the quantification of p-PP1 vs. PP1 intensity. WT = 1.00 ± 0.04 (n = 3 mice), G93A = 0.76 ± 0.05 (n = 3 mice). Values are mean ± S.E.M. F(1,4) = 3.832, *P = 0.0186 by two-sided Student’s t-test.

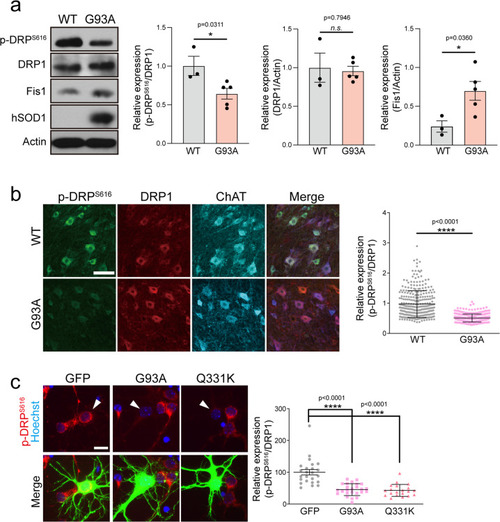
Effects of the blockade of PP1 on G93A and Q331-induced neurodegeneration.

a The representative image of mitochondria in the neurite of GFP+ primary cortical neuron with 40 nM I-2 treatment or shRNA lenti-viral infection after transfection of dsRed-mito and mALS genes, over 72 h. The mitochondrial image has been embossed using Photoshop and measured on the GFP+ cortical neuron. Scale bar, 5 μm. b Analysis of mitochondrial length in (a). GFP:CON = 1.00 ± 0.06 (n = 29 GFP+ neurons), GFP:shPP1α = 1.1 ± 0.09 (n = 17 GFP+ neurons) GFP:shPP1β=0.79 ± 0.87 (n = 7 GFP+ neurons), GFP:shPP1γ = 1.08 ± 0.05 (n = 27 GFP+ neurons), GFP:I-2 = 0.96 ± 0.05 (n = 30 GFP+ neurons), G93A:CON = 0.7 ± 0.02 (n = 30 GFP+ neurons), G93A:shPP1α = 1.00 ± 0.4 (n = 33 GFP+ neurons), G93A:shPP1β = 0.66 ± 0.02 (n = 30 GFP+ neurons), G93A:shPP1γ = 0.99 ± 0.05 (n = 20 GFP+ neurons), G93A:I-2 = 1.04 ± 0.06 (n = 30 GFP+ neurons), Q331K:CON = 0.65 ± 0.02 (n = 30 GFP+ neurons), Q331K:shPP1α = 1.1 ± 0.06 (n = 31 GFP+ neurons), Q331K:shPP1β = 0.74 ± 0.03 (n = 30 GFP+ neurons), Q331K:shPP1γ = 0.89 ± 0.6 (n = 19 GFP+ neurons), Q331K:I-2 = 0.98 ± 0.05 (n = 35 GFP+ neurons). Values are mean ± S.E.M. F(2,86) = 26.64, ****P < 0.0001 for CON groups; F(4,105) = 1.710, n.s.: not significant for GFP groups; F(4,138) = 20.02, ###P = 0.0001, ####P < 0.0001 for G93A groups; F(4,138) = 20.02, ##P = 0.0089, ####P < 0.0001 for Q331K groups by one-way ANOVA with Tukey’s post hoc analysis for multiple comparisons. c Quantification of cleaved caspase-3-positive neurons in GFP+ neurons with 40 nM I-2 treatment or shRNA lenti-viral infection following transfection of mALS genes, over 72 h. GFP:CON = 7.67 ± 2.06 (n = 6 independent primary culture), GFP:shPP1α = 35.61 ± 12.54 (n = 2 independent primary culture), GFP:shPP1β=8.28 ± 0.75 (n = 3 independent primary culture), GFP:shPP1γ = 17.11 ± 4.65 (n = 3 independent primary culture), GFP:I-2 = 7.5 ± 2.51 (n = 5 independent primary culture), G93A:CON = 26.59 ± 2.31 (n = 5 independent primary culture), G93A:shPP1α = 37.09 ± 5.51 (n = 2 independent primary culture), G93A:shPP1β = 18.39 ± 2.45 (n = 2 independent primary culture), G93A:shPP1γ = 12.09 ± 2.63 (n = 3 independent primary culture), G93A:I-2 = 13.79 ± 0.84 (n = 4 independent primary culture), Q331K:CON = 34.83 ± 1.370 (n = 3 independent primary culture), Q331K:shPP1α = 32.39 ± 2.39 (n = 2 independent primary culture), Q331K:shPP1β = 17.03 ± 6.39 (n = 3 independent primary culture), Q331K:shPP1γ=17.07 ± 1.44 (n = 3 independent primary culture), Q331K:I-2 = 12.57 ± 2.60 (n = 3 independent primary culture). Values are mean ± S.E.M. F(2,11) = 41.29, ****P < 0.0001 for CON groups; F(4,14) = 7.230, ***P = 0.0007 for GFP groups; F(4,11) = 14.03, ##P = 0.0096 for G93A:CON versus G93A: shPP1γ, ##P = 0.0073 for G93A:CON versus G93A: I-2; F(4,9) = 7.887, #P = 0.0327 for Q331K:CON versus Q331K: shPP1β, #P = 0.0327 for Q331K:CON versus Q331K: shPP1γ, ##P = 0.0089 by one-way ANOVA followed by Tukey’s multiple comparisons test. d Quantification of pyknotic cell in GFP+ neurons with 40 nM I-2 treatment or shRNA lenti-viral infection following transfection of mALS genes, over 72 h. GFP:CON = 9.39 ± 2.33 (n = 6 independent primary culture), GFP:shPP1α = 45.01 ± 14.25 (n = 2 independent primary culture), GFP:shPP1β = 11.08 ± 2.31 (n = 3 independent primary culture), GFP:shPP1γ = 15.40 ± 5.19 (n = 3 independent primary culture), GFP:I-2 = 6.64 ± 2.67 (n = 5 independent primary culture), G93A:CON = 34.85 ± 4.25 (n = 6 independent primary culture), G93A:shPP1α=41.18 ± 6.97 (n = 2 independent primary culture), G93A:shPP1β = 15.78 ± 0.16 (n = 2 independent primary culture), G93A:shPP1γ = 13.13 ± 4.84 (n = 3 independent primary culture), G93A:I-2 = 17.98 ± 3.12 (n = 5 independent primary culture), Q331K:CON = 42.76 ± 7.15 (n = 3 independent primary culture), Q331K:shPP1α = 38.71 ± 6.21 (n = 2 independent primary culture), Q331K:shPP1β = 21.69 ± 2.95 (n = 3 independent primary culture), Q331K:shPP1γ = 22.14 ± 1.44 (n = 3 independent primary culture), Q331K:I-2 = 14.45 ± 2.93 (n = 3 independent primary culture). Values are mean ± S.E.M. F(2,12) = 17.58, **P = 0.0012, ***P = 0.0007 for each CON group; F(4,14) = .101, ***P = 0.0007 for each GFP group; F(4,13) = 6.49, #P = 0.0245 for G93A:CON versus G93A:shPP1γ, #P = 0.0441 for G93A:CON versus G93A:I-2; F(4,9) = 7.405, #P = 0.0433 for Q331K:CON versus Q331K: shPP1β, #P = 0.0483 for Q331K:CON versus Q331K: shPP1γ, ##P = 0.0080 by one-way ANOVA followed by Tukey’s multiple comparisons test. e Analysis of total neurite length in (a). GFP:CON = 100 ± 8.70 (n = 57 GFP+ neurons), GFP:I-2 = 115.90 ± 9.90 (n = 22 GFP+ neuron), GFP: shPP1α=130.3 ± 18.51 (n = 9 GFP+ neuron), GFP:shPP1β=72.12 ± 8.25 (n = 16 GFP+ neuron), GFP:shPP1γ=60.66 ± 5.05 (n = 29 GFP+ neuron), G93A:CON = 61.61 ± 3.10 (n = 91 GFP+ neuron), G93A:I-2 = 106.3 ± 7.51 (n = 27 GFP+ neuron), G93A:shPP1α = 93.39 ± 13.05 (n = 21 GFP+ neuron), G93A:shPP1β = 57.56 ± 4.52 (n = 23 GFP+ neuron), G93A:shPP1γ = 88.06 ± 11.45 (n = 26 GFP+ neuron), Q331K:CON = 42.39 ± 3.47 (n = 25 GFP+ neuron), Q331K:I-2 = 122.2 ± 10.61 (n = 21 GFP+ neuron), Q331K:shPP1α=128.8 ± 17.3 (n = 23 GFP+ neuron), Q331K:shPP1β = 60.97 ± 6.15 (n = 27 GFP+ neuron), Q331K:shPP1γ = 94.81 ± 11.55 (n = 37 GFP+ neuron),. Values are mean ± S.E.M. F(2,170) = 19.98, ****P < 0.0001 for each CON group;F(4,128) = 7.415, #P = 0.0106, ##P = 0.0025 for GFP:I-2 versus GFP:shPP1γ, ##P = 0.0057 for GFP:shPP1α versus GFP:shPP1γ; F(4,183)=9.91, #P = 0.0235, #P = 0.0089, ###P = 0.0008 for each G93A group; F(4,128) = 10.63, ##P = 0.0044, ####P < 0.0001 for each Q331K group by one-way ANOVA followed by Tukey’s multiple comparisons test. f Analysis of total axonal length in (a). GFP:CON = 100 ± 10.33 (n = 56 GFP+ neuron), GFP:I-2 = 119.4 ± 11.51 (n = 22 GFP+ neuron), GFP: shPP1α = 141.4 ± 24.44 (n = 9 GFP+ neuron), GFP:shPP1β = 73.71 ± 9.06 (n = 16 GFP+ neuron), GFP:shPP1γ = 59.58 ± 6.13 (n = 29 GFP+ neuron), G93A:CON = 54.08 ± 3.02 (n = 86 GFP+ neuron), G93A:I-2 = 80.63 ± 4.57 (n = 27 GFP+ neuron), G93A:shPP1α = 02.8 ± 15.10 (n = 21 GFP+ neuron), G93A:shPP1β = 58.73 ± 6.10 (n = 23 GFP+ neuron), G93A:shPP1γ = 95.06 ± 13.3 (n = 26 GFP+ neuron), Q331K:CON = 49.70 ± 7.46 (n = 28 GFP+ neuron), Q331K:I-2 = 131.7 ± 15.21 (n = 21 GFP+ neuron), Q331K:shPP1α = 145.8 ± 20.67 (n = 23 GFP+ neuron), Q331K:shPP1β = 60.02 ± 7.01 (n = 27 GFP+ neuron), Q331K:shPP1γ = 98.4 ± 12.79 (n = 37 GFP+ neuron). Values are mean ± S.E.M. F(2, 167) = 15.91, ***P = 0.0001, ****P < 0.0001 for each CON group; F(4,127) = 5.083, #P = 0.0386 for each GFP group;F(4,178) = 9.565, #P = 0.0356, ###P = 0.0002, ####P < 0.0001 for each G93A group;F(4,131) = 4.236, #P = 0.0395, ###P = 0.0005, ####P < 0.0001 for each Q331K group by one-way ANOVA followed by Tukey’s multiple comparisons test.

Effects of the blockade of PP1 on the complex I activity of mitochondria in the ALS model.

a The histological image of NADH dehydrogenase activity and biochemical measurement of complex I activity on the MNs of the lumbar spinal cord in G93A and WT mice at 60 days of age. The inset graph shows the average of the complex I activity value. WT = 99.74 ± 3.83 (n = 4 mice), G93A = 62.9 ± 12.37 (n = 4 mice). Values are mean ± S.E.M. F(1,6) = 2.87, *P = 0.0284 by two-sided Student’s t-test. Scale bar, 100 μm. b The activity of mitochondrial complex I in primary cortical neurons cultured from WT and G93A mice following treatment with 25 µM Mdivi-1 or 80 nM I-2 for 72 h. WT:CON = 99.69 ± 6.81 (n = 3 independent primary culture), WT:Mdivi-1 = 99.37 ± 8.55 (n = 3 independent primary culture), WT:I-2 = 113.9 ± 9.12 (n = 4 independent primary culture), G93A:CON = 77.36 ± 5.33 (n = 5 independent primary culture), G93A:Mdivi-1 = 88.09 ± 7.70 (n = 8 independent primary culture), G93A:I-2 = 113.7 ± 7.09 (n = 7 independent primary culture). Values are mean ± S.E.M. F(1,6)=2.58, *P = 0.0421 for WT:CON versus G93A:CON by by two-sided Student’s t-test; F(2,17)=6.22, #P = 0.0110 for G93A:CON versus G93A:I-2, n.s. = not significant group by one-way ANOVA followed by Tukey’s multiple comparisons test. c The representative images and measurement of MMP in GFP+ primary cortical neurons following mALS gene transfection with 25 µM Mdivi-1 or 80 nM I-2 treatment for 72 h. GFP:CON = 1 ± 0.07 (n = 15 GFP+ primary cortical neurons), GFP:Mdivi-1 = 0.73 ± 0.08 (n = 16 GFP+ primary cortical neurons), GFP:I-2 = 0.92 ± 0.06 (n = 16 GFP+ primary cortical neurons), G93A:CON = 0.66 ± 0.06 (n = 23 GFP+ primary cortical neurons), G93A:Mdivi-1 = 0.64 ± 0.07 (n = 17 GFP+ primary cortical neurons), G93A:I-2 = 0.96 ± 0.07 (n = 22 GFP+ primary cortical neurons), Q331K:CON = 0.64 ± 0.07 (n = 17 GFP+ primary cortical neurons), Q331K:Mdivi-1 = 0.57 ± 0.04 (n = 11 GFP+ primary cortical neurons), Q331K:I-2 = 0.97 ± 0.10 (n = 16 GFP+ primary cortical neurons). Values are mean ± S.E.M. F(2,52) = 7.529, **P = 0.0030 for GFP:CON versus G93A:CON, **P = 0.0037 for GFP:CON versus Q331K:GFP; F(2,44) = 3.86, *P = 0.0268 for GFP:CON versus GFP:Mdivi-1; F(2,59) = 7.184, **P = 0.0048 for G93A:CON versus G93A:I-2; F(2,41) = 6.87, *P = 0.0119 for Q331K:CON versus Q331K:I-2 by one-way ANOVA followed by Tukey’s multiple comparisons test. Scale bar, 20 μm.

Effects of the suppression of PP1 in ALS-associated zebrafish and human iPS cell models.

a Motor axons of zebrafish treated with 200 nM I-2 or 100 nM OA daily for 2 days following transient expression of G93A or Q331K mutations. The red dashed-line square indicates a magnified image of motor axons. The blue arrowhead indicates the ventral projection of the motor axon, and the yellow arrowhead indicates neuromuscular junction. b Analysis of axonal defects in (a). CON = 0.14 ± 0.36 (n = 14 zebrafish), G93A:Non = 2.93 ± 0.29 (n = 14 zebrafish), G93A:I-2 = 0.86 ± 0.23 (n = 14 zebrafish), G93A:OA = 0.73 ± 0.21 (n = 30 zebrafish), Q331K:Non = 3.71 ± 0.19 (n = 14 zebrafish), Q331K:I-2 = 1.00 ± 0.27 (n = 14 zebrafish), Q331K:OA = 1.43 ± 0.39 (n = 14 zebrafish). Values are mean ± S.E.M. F(2,39) = 81.83, ****P < 0.0001 for CON versus G93A:Non and CON versus Q331K:Non;F(2,55) = 21.78, ####P < 0.0001 for G93A:CON versus G93A:I-2 and G93A:CON versus G93A:OA; F(2,39) = 25.12, &&&&P < 0.0001 for Q331K:CON versus Q331K:I-2 and Q331K:CON versus Q331K:OA by one-way ANOVA followed by Tukey’s multiple comparisons test. c Analysis of axonal length in (a). CON = 162.5 ± 2.77 (n = 6 zebrafish), G93A:Non = 122 ± 2.96 (n = 13 zebrafish), G93A:Mdivi-1 = 141.4 ± 2.45 (n = 13 zebrafish), G93A:I-2 = 151.1 ± 1.56 (n = 14 zebrafish), Q331K:Non = 23.3 ± 5.82 (n = 10 zebrafish), Q331K:Mdivi-1 = 141.3 ± 3.37 (n = 14 zebrafish), Q331K:I-2 = 145.3 ± 3.14 (n = 14 zebrafish). Values are mean ± S.E.M. F(2,26) = 21.27, ****P < 0.0001 for CON versus G93A:Non and CON versus Q331K:Non;F(2,37) = 39.83, ####P < 0.0001 for G93A:CON versus G93A:Mdivi-1 and G93A:CON versus G93A:I-2, #P = 0.0156 for G93A:Mdivi-1 versus G93A:I-2;F(2,35 )= 7.755, &P = 0.0104 for Q331K:CON versus Q331K:Mdivi-1, &&P = 0.0017 for Q331K:CON versus Q331K:I-2 by one-way ANOVA followed by Tukey’s multiple comparisons test. d Immunostaining of cleaved caspase-3 and ChAT in 3-week-old MNs of control and mTDP-43 lines treated with 80 nM I-2 every other day for 2 weeks. Scale bar, 25 μm. e Measurement of mitochondrial length in 3-week-old MNs of control and mTDP-43 lines treated with 80 nM I-2 every other day for 2 weeks. CON:I-2(−) = 2.42 ± 0.07 (n = 38 ChAT+ neurons), CON:I-2(+) = 3.24 ± 0.13 (n = 37 ChAT+ neurons), mTDP-43:I-2(−) = 1.75 ± 0.06 (n = 38 ChAT+ neurons), mTDP-43:I-2(+) = 2.63 ± 0.11 (n = 36 ChAT+ neurons). Values are mean ± S.E.M. F(1,74) = 6.837, ****P < 0.0001 for CON:I-2(−) versus mTDP-43:I-2(−); F(1,73) = 5.538, ****P < 0.0001 for CON:I-2(−) versus CON:I-2(+); F(1,72) = 6.840, ****P < 0.0001 for mTDP-43:I-2(−) versus mTDP-43:I-2(+) for by two-sided Student’s t-test. f Quantification of cleaved caspase-3+ cell in human iPS-derived ChAT+ neuron in (d). CON:I-2(−) = 7.86 ± 0.42 (n = 3 iPS cell lines), CON:I-2(+) = 7.96 ± 0.89 (n = 3 iPS cell lines), mTDP-43:I-2(−) = 31.47 ± 3.34 (n = 3 iPS cell lines), mTDP-43:I-2(+) = 15.67 ± 2.06 (n = 3 iPS cell lines). Values are mean ± S.E.M. F(1,4) = 7.01, **P = 0.0022 for CON:I-2(−) versus mTDP-43:I-2(−); F(1,4) = 4.03, *P = 0.0158 for mTDP-43:I-2(−) versus mTDP-43:I-2(+) for by two-sided Student’s t-test. g Quantification of pyknotic cell in ChAT+ neuron in (d). Values are mean ± S.E.M. (N = 3 lines in CON and mTDP-43; *p < 0.05, **p < 0.01 in two-sided Student’s t-test). CON:I-2(−) = 14.37 ± 0.84 (n = 3 iPS cell lines), CON:I-2(+) = 10.43 ± 0.75 (n = 3 iPS cell lines), mTDP-43:I-2(−) = 7.11 ± 4.04 (n = 3 iPS cell lines), mTDP-43:I-2(+) = 18.99 ± 1.71 (n = 3 iPS cell lines). Values are mean ± S.E.M. F(1,4) = 5.514, **P = 0.0053 for CON:I-2(−) versus mTDP-43:I-2(−); F(1,4) = 4.131, *P = 0.0145 for mTDP-43:I-2(−) versus mTDP-43:I-2(+) for by two-sided Student’s t-test.

Hypothetical schematic diagram: abnormal promotion of PP1 activity in the MNs of ALS and dephosphorylation of the S616 site of Drp1, resulting in the induction of mitochondrial fragmentation.

Also, abnormal PP1 activity decreases the mitochondrial complex I activity, leading to axonal degeneration. Thus, the blockade of PP1 activity reduces the ALS-induced mitochondrial fission and improves mitochondrial functions such as the complex I activity of the mitochondrial electron transport chain and membrane potential, resulting in improvement of axonal impairment. Therefore, inhibition of excessive PP1 activity may promote MN survival by improving mitochondrial function.

Acknowledgments
This image is the copyrighted work of the attributed author or publisher, and ZFIN has permission only to display this image to its users. Additional permissions should be obtained from the applicable author or publisher of the image. Full text @ Cell Death Dis.