
- Title
-
A Zebrafish Model of Retinitis Pigmentosa Shows Continuous Degeneration and Regeneration of Rod Photoreceptors
- Authors
- Santhanam, A., Shihabeddin, E., Atkinson, J.A., Nguyen, D., Lin, Y.P., O'Brien, J.
- Source
- Full text @ Cells

P23H mutant rhodopsin transgene construct. Mouse rhodopsin carrying the P23H mutation and a C-terminal Flag tag is driven by a 1.8 kb Zebrafish rhodopsin promoter.
Construct:
Tg(rho:Mmu.Rho_P23H-FLAG)
|
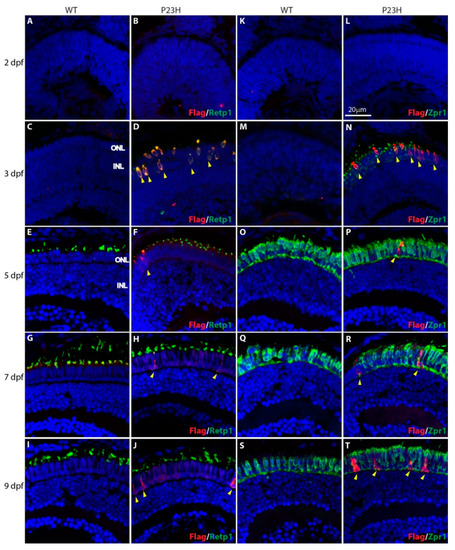
Expression of P23H Flag-tagged rhodopsin at early stages of photoreceptor development in wild type (WT) and P23H transgenic (P23H) zebrafish. Expression of P23H mutant rhodopsin (Flag; red) and rhodopsin (Retp1; green) at 2 dpf ( |
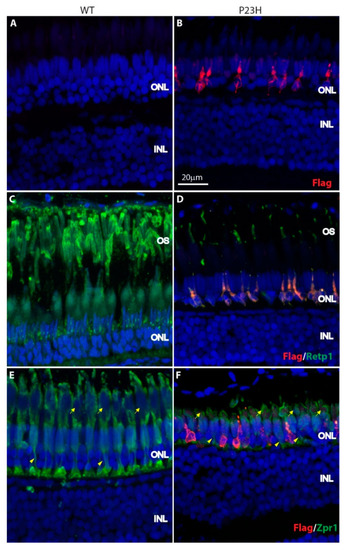
Expression of P23H Flag-tagged rhodopsin in adult zebrafish retina. ( PHENOTYPE:
|
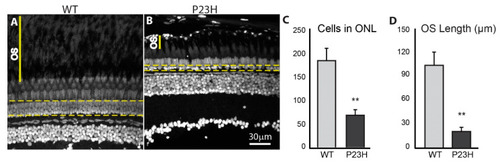
Photoreceptor loss in the P23H transgenic zebrafish. DAPI label of adult retina sections. The yellow dotted lines encompass nuclei in the ONL counted to assess photoreceptor loss. OS indicates the space between photoreceptor myoids and retinal pigmented epithelium. The number of cells in the ONL is almost three times greater in the WT ( PHENOTYPE:
|
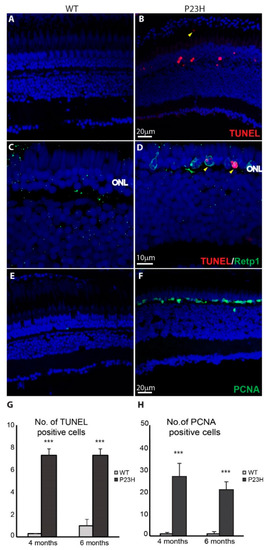
Cell death and cell proliferation in the P23H transgenic zebrafish. ( |

Continuous cell proliferation in the P23H transgenic zebrafish. Wholemount imaging of BrdU (red) labeled cells in ONL of the WT ( PHENOTYPE:
|
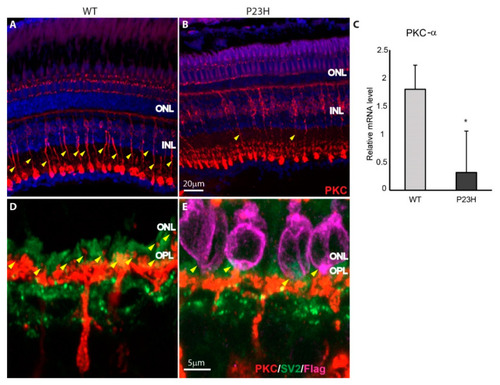
Bipolar cell synapses in P23H transgenic retina. ( |
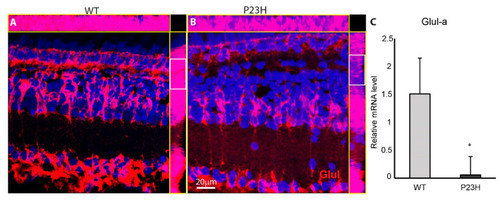
Glutamine synthetase (Glul) immunostaining is weak in the P23H transgenic fish. ( |