
- Title
-
Somatostatin 1.1 contributes to the innate exploration of zebrafish larva
- Authors
- Quan, F.B., Desban, L., Mirat, O., Kermarquer, M., Roussel, J., Koëth, F., Marnas, H., Djenoune, L., Lejeune, F.X., Tostivint, H., Wyart, C.
- Source
- Full text @ Sci. Rep.
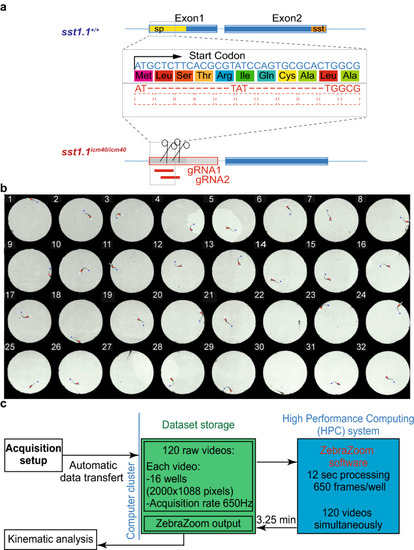
Generation of the |
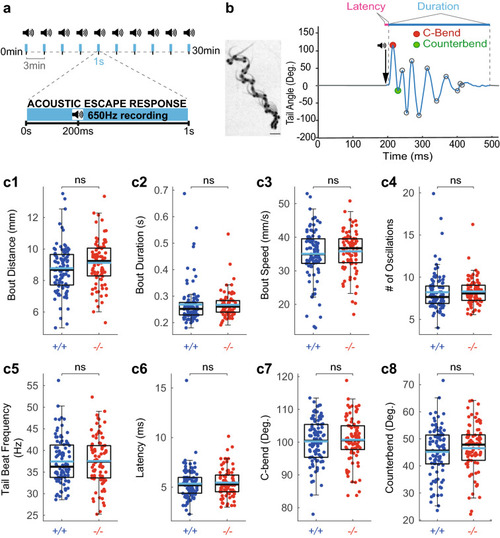
Somatostatin 1.1 does not contribute to the kinematic of acousto-vestibular escape responses. ( PHENOTYPE:
|
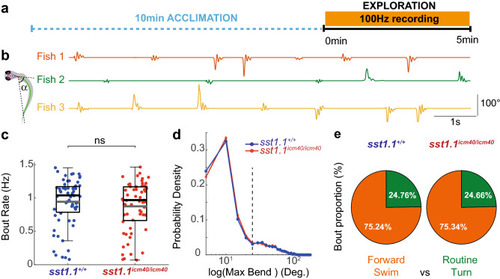
Somatostatin 1.1 does not contribute to the bout rate nor to the ratio of forward bouts and turns during exploration. ( PHENOTYPE:
|
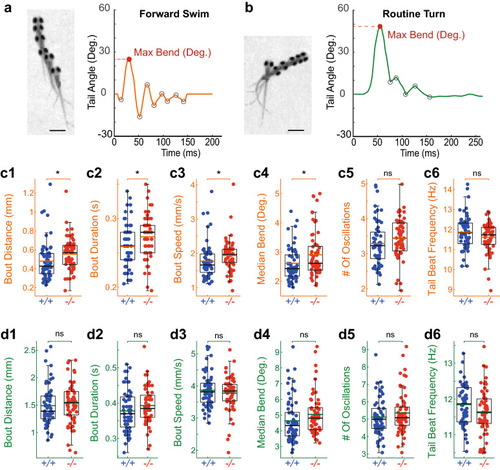
PHENOTYPE:
|