
- Title
-
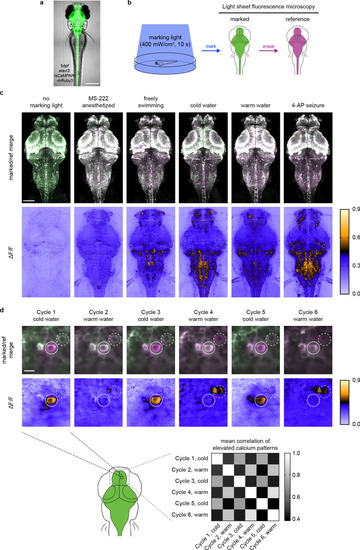
Erasable labeling of neuronal activity using a reversible calcium marker
- Authors
- Sha, F., Abdelfattah, A.S., Patel, R., Schreiter, E.R.
- Source
- Full text @ Elife
Each image is a maximum intensity Z projection of the entire brain from zebrafish larvae (4 to 5 dpf). Top half of images are merged marked and reference erased images, pseudo-colored green and magenta, respectively. Bottom half of images are corresponding ΔF/F images. Imaging conditions and brightness/contrast are identical to images shown in |
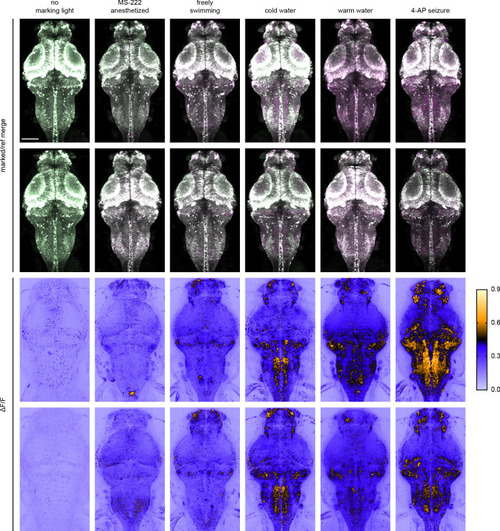
Each image is a maximum intensity Z projection of the entire brain from zebrafish larvae (4 to 5 dpf). Top half of images are merged marked and reference erased images, pseudo-colored green and magenta, respectively. Bottom half of images are corresponding ΔF/F images. Imaging conditions and brightness/contrast are identical to images shown in |
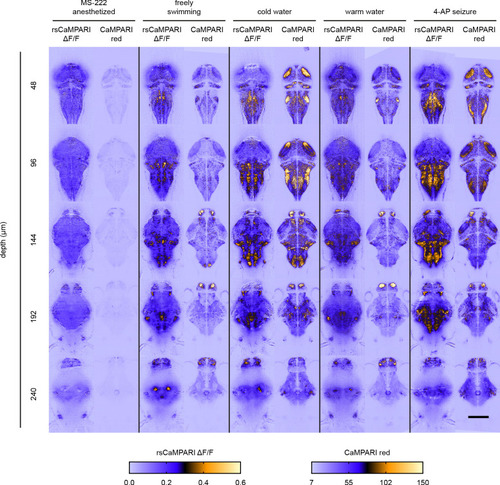
Each image is an individual Z slice acquired at various depths from the brain of zebrafish larvae (4 to 5 dpf). Under each stimulus condition, images to the left are rsCaMPARI ΔF/F light sheet images from a fish expressing rsCaMPARI and images to the right are CaMPARI red confocal images from a different fish expressing CaMPARI. Scale bar is 200 μm. |
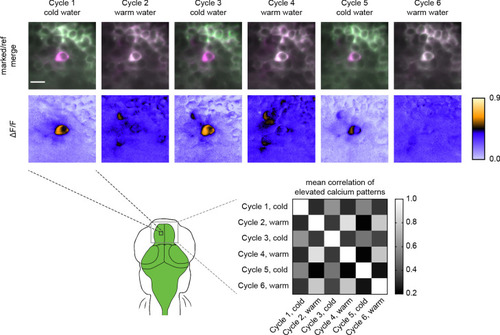
Top panels are individual Z slices from the pallium of the same fish (5 dpf) brain illustrating the same field of view from six marking cycles of alternating cold and warm water stimulus. Scale bar is 10 μm. Bottom-right panel is a normalized correlation matrix comparing labeling patterns in the upper pallium and habenula across multiple marking cycles in the same fish. |
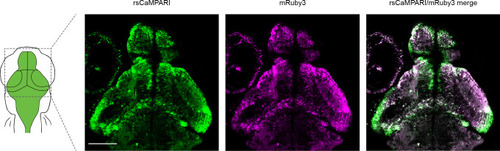
Two-photon image of rsCaMPARI-mRuby3 in five dpf zebrafish brain without prior exposure to marking light. Excitation wavelength is 960 nm with detection wavelength ranges of 490–534 nm and 570–695 nm for rsCaMPARI and mRuby3, respectively. Note the general lack of mRuby3 fluorescence in nascent neurons in the periphery of brain structures, presumably due to its long maturation time. Scale bar is 100 μm. |
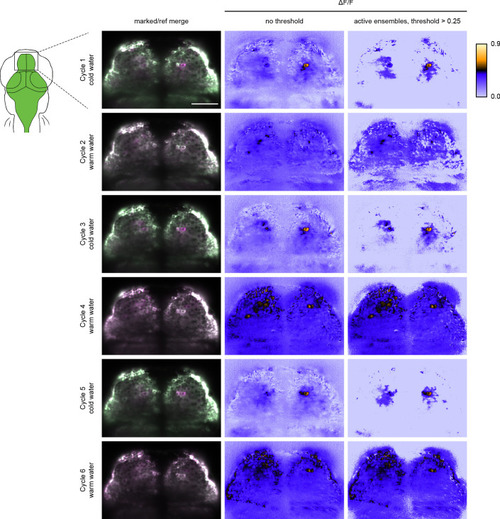
Left image panels are merged marked (green) and reference erased (pseudo-colored magenta) images from the same Z position in the zebrafish pallium. Center image panels are the corresponding ΔF/F images. Right image panels are the corresponding images with threshold above 0.25 ΔF/F. Scale bar is 50 μm. |