FIGURE SUMMARY
Title

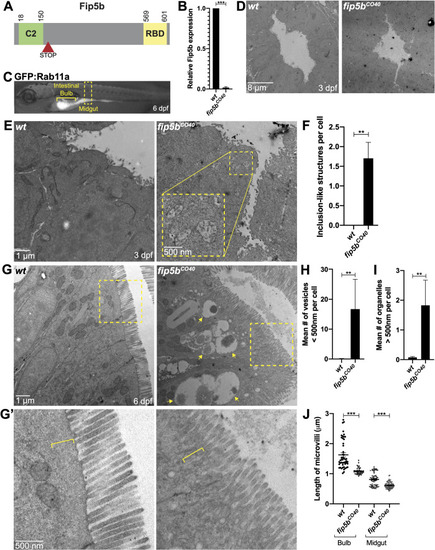
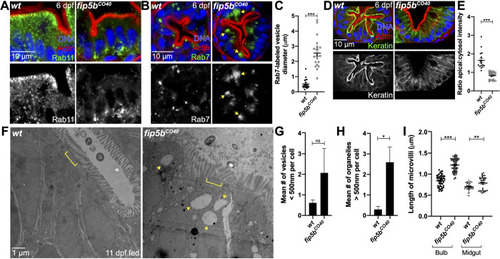
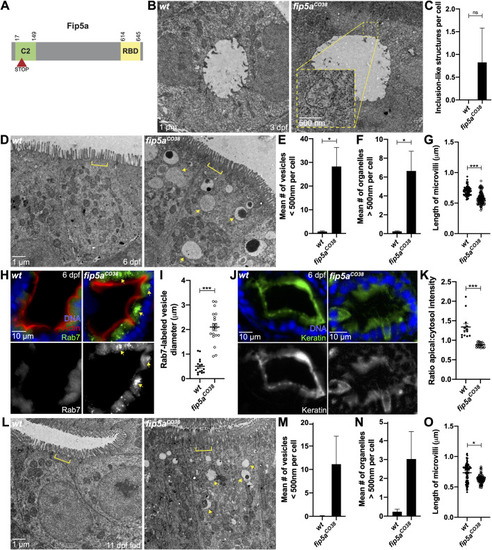
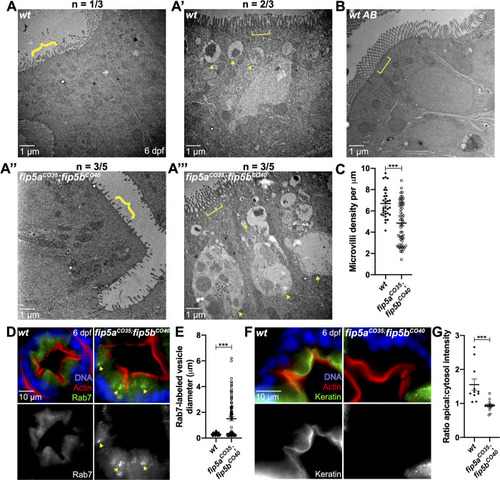
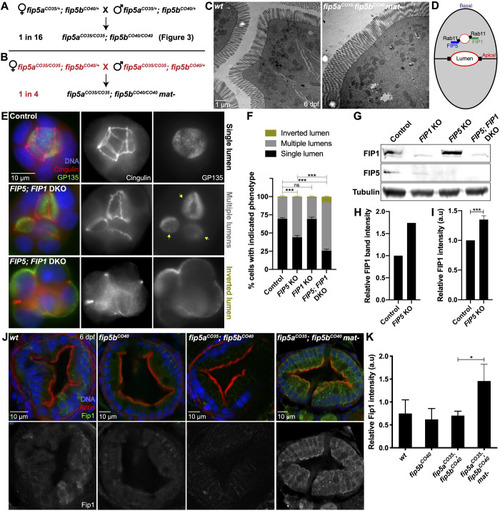
The Rab11 effectors Fip5 and Fip1 regulate zebrafish intestinal development

Authors
Jewett, C.E., Appel, B.H., Prekeris, R.
Source
Full text @ Biol. Open

Zebrafish intestinal microvilli establishment requires Fip5b. (A) Domain schematic of zebrafish Fip5b protein containing a C2 domain at the N-terminus and a Rab-binding domain (RBD) at the C-terminus. The red arrowhead with STOP denotes premature termination codon in fip5b mutant alleles. (B) qRT-PCR for fip5b in wild-type and fip5bCO40 mutant larvae at 6 dpf. n=50 larvae for each condition. (C) 6 dpf larvae expressing Tg(hsp:GFP:Rab11a) labeling the intestine. The intestinal bulb is denoted by a bracket and the midgut by a dashed box. All following images are representative cross sections through the midgut region. Wild-type siblings are used as controls. For all experiments, three separate animals for each condition were analyzed. (D) Electron micrographs showing 3 dpf wild-type and fip5bCO40 mutant larvae. Luminal space is lighter gray region. (E) High magnification electron micrographs showing 3 dpf wild-type and fip5bCO40 mutant larvae. Yellow box shows zoomed in view on a region with subapical microvillus inclusion-like structures. (F) Quantitation of the mean number of inclusion-like structures per cell in 3 dpf wild-type and fip5bCO40 mutant larvae. (G) Electron micrographs showing 6 dpf wild-type and fip5bCO40 mutant larvae. Arrows point to larger than 500 nm organelles and boxes outline magnified region shown in (G′). (G′) Magnified view of apical cell surface showing terminal web and microvilli. Brackets denote electron dense line and organelle-free zone comprising the terminal web or lack thereof in mutants. (H) Quantitation of less than 500 nm apical vesicles in 6 dpf larvae. (I) Quantitation of greater than 500 nm organelles in 6 dpf larvae. (J) Quantitation of microvilli length in the intestinal bulb and midgut in 6 dpf larvae. Each dot represents a single microvillus length combined across three animals. All plots show mean±s.e.m. A t-test was used for Gaussian data and a Mann–Whitney test for all other statistics. ***P<0.0005, **P<0.005.

Endosome maturation and terminal web keratin organization requirefip5bfunction. All following images are representative cross sections through the midgut region. Wild-type siblings are used as controls. For all experiments, three separate animals for each condition were analyzed. (A,B,D) Immunohistochemistry on cross sections of 6 dpf wild-type and Fip5bCO40 mutant larvae stained with Hoechst (blue), Phalloidin (red), and Rab11 (A), Rab7 (B), or Cytokeratin (D) (green). (C) Quantitation of Rab7-vesicle diameter. (E) Ratio of fluorescence intensity of apical keratin to cytoplasmic keratin. (F) Electron micrographs showing 11 dpf fed wild-type and fip5bCO40 mutant larvae. Arrows point to larger than 500 nm organelles and brackets mark terminal web. (G) Quantitation of less than 500 nm apical vesicles in 11 dpf larvae. (H) Quantitation of greater than 500 nm organelles in 11 dpf larvae. (I) Quantitation of microvilli length in the intestinal bulb and midgut of 11 dpf larvae. Each dot represents a single microvillus length combined across three animals. All plots show mean±s.e.m. A t-test was used for Gaussian data and a Mann–Whitney test for all other statistics. ***P<0.0005, **P<0.005, *P<0.05.

fip5a functions similarly to fib5b in endosome maturation and terminal web organization. (A) Domain schematic of zebrafish Fip5a protein containing a C2 domain at the N-terminus and a Rab-binding domain (RBD) at the C-terminus. The red arrowhead with STOP denotes premature termination codon in fip5a mutant alleles. All following images are representative cross sections through midgut region. Wild-type siblings are used as controls. For all experiments, three separate animals for each condition were analyzed. (B) Electron micrographs showing 3 dpf wild-type and fip5aCO38 mutant larvae. Yellow box shows zoomed in view on a region with subapical structures resembling microvillus inclusions. (C) Quantitation of the mean number of microvillus inclusion-like structures per cell in 3 dpf wild-type and fip5aCO38 mutant larvae. (D) Electron micrographs showing 6 dpf wild-type and fip5aCO38 mutant larvae. Arrows point to larger than 500 nm organelles and brackets mark terminal web or lack thereof in mutants. (E) Quantitation of less than 500 nm apical vesicles in 6 dpf larvae. (F) Quantitation of greater than 500 nm organelles in 6 dpf larvae. (G) Quantitation midgut microvilli length in 6 dpf larvae. Each dot represents a single microvillus length combined across three animals. (H) Immunohistochemistry on cross sections of 6 dpf wild-type and fip5aCO38 mutant larvae stained with Hoechst (blue), Phalloidin (red), and Rab7 (green). (I) Quantitation of Rab7-vesicle diameter. (J) Immunohistochemistry on cross sections of 6 dpf wild-type and fip5aCO38 mutant larvae stained with Hoechst (blue) and Cytokeratin (green). (K) Ratio of fluorescence intensity of apical keratin to cytoplasmic keratin. (L) Electron micrographs showing 11 dpf fed wild-type and fip5aCO38 mutant larvae. Arrows point to larger than 500 nm organelles and brackets mark terminal web or lack thereof in mutants. (M) Quantitation of less than 500 nm apical vesicles in 11 dpf larvae. (N) Quantitation of greater than 500 nm organelles in 11 dpf larvae. (O) Quantitation midgut microvilli length in 11 dpf larvae. Each dot represents a single microvillus length combined across three animals. All plots show mean±s.e.m. A t-test was used for Gaussian data and a Mann–Whitney test for all other statistics. ***P<0.0005, *P<0.05.

fip5a and fip5b double mutants show severe microvilli and trafficking phenotypes. All following images are representative cross sections through the midgut region of 6 dpf larvae. (A–A′′′′) Electron micrographs showing wild-type siblings and fip5aCO35/CO35; fip5bCO40/CO40 zygotic mutant larvae. Arrows point to larger than 500 nm organelles, braces point out sparse microvilli and brackets mark terminal web or lack thereof in mutants. N indicates number of representative larvae out of total number of larvae analyzed. (B) Electron micrograph showing wild-type AB larva. (C) Quantitation of microvilli density. Each dot represents the number of microvilli per micron for a field of view across three wild-type and five mutant animals. (D) Immunohistochemistry on cross sections of wild-type and fip5aCO35; fip5bCO40 mutant larvae stained with Hoechst (blue), Phalloidin (red), and Rab7 (green). (E) Quantitation of Rab7-vesicle diameter. (F) Immunohistochemistry on cross sections of wild-type and fip5aCO35; fip5bCO40 mutant larvae stained with Hoechst (blue), Phalloidin (red) and Cytokeratin (green). (G) Ratio of fluorescence intensity of apical keratin to cytoplasmic keratin. Three separate animals for each condition were analyzed. All plots show mean±s.e.m. A t-test was used for Gaussian data and a Mann–Whitney test for all other statistics. ***P<0.0005.

Upregulation of Fip1 rescues fip5a and fip5b double-mutant phenotypes. (A,B) Schematic of genetic crosses resulting in fip5aCO35; fip5bCO40 double zygotic or maternal/zygotic (mat-) mutant offspring generated from two different parental genotypes. (C) Electron micrographs showing cross sections through midgut of 6 dpf wild-type AB and fip5aCO35; fip5bCO40 mat- mutant larvae. Three separate animals for each condition were analyzed. (D) Cartoon schematic showing FIP5 and FIP1 bind same Rab11 vesicles. (E) Wild-type and FIP5; FIP1 double KO (DKO) MDCK cells grown in an extracellular matrix to induce 3D lumen formation. Arrows denote multiple lumens in KO cyst. (F) Quantitation of luminal phenotypes from three biological replicates. (G) Western blot on wild-type and KO MDCK cell lysates probed for FIP1, FIP5 or tubulin (control) antibodies. (H) Quantitation of FIP1 band intensity for wild-type and FIP5 KO cell lysates from one biological replicate. (I) Quantitation of FIP1 fluorescence intensity in wild-type and FIP5 KO cells grown in polarized monolayers from three biological replicates. Representative images are shown in Fig. S4A. (J) Immunohistochemistry on cross sections through midgut of 6 dpf wild-type, fip5bCO40 mutant, fip5aCO35; fip5bCO40 double mutant and fip5aCO35; fip5bCO40 mat- mutant larvae stained with Hoechst (blue), Phalloidin (red) and Fip1 (green). (K) Quantitation of fluorescence intensity of Fip1. Three separate animals for each condition were analyzed. All plots show mean±s.e.m. A t-test was used for Gaussian data and a Mann–Whitney test for all other statistics. ***P<0.0005, *P<0.05.

ZFIN is incorporating published figure images and captions as part of an ongoing project. Figures from some publications have not yet been curated, or are not available for display because of copyright restrictions.

EXPRESSION / LABELING:
Genes:
Fish:
Anatomical Terms:
Stage Range: Long-pec to Days 7-13

ZFIN is incorporating published figure images and captions as part of an ongoing project. Figures from some publications have not yet been curated, or are not available for display because of copyright restrictions.

Unillustrated author statements

Acknowledgments
This image is the copyrighted work of the attributed author or publisher, and ZFIN has permission only to display this image to its users. Additional permissions should be obtained from the applicable author or publisher of the image. Full text @ Biol. Open