FIGURE SUMMARY
Title

Autophagic flux inhibition enhances cytotoxicity of the receptor tyrosine kinase inhibitor ponatinib

Authors
Corallo, D., Pastorino, F., Pantile, M., Mariotto, E., Caicci, F., Viola, G., Ponzoni, M., Tonini, G.P., Aveic, S.
Source
Full text @ J. Exp. Clin. Cancer Res.

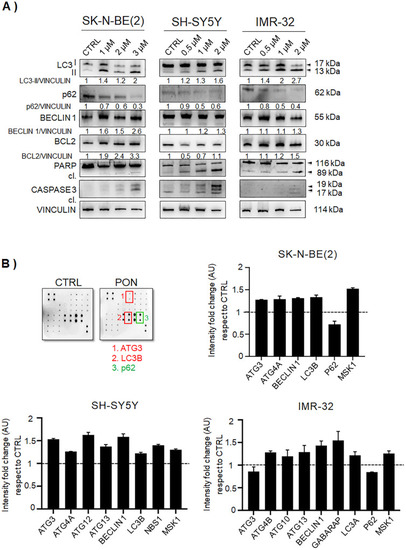
PON induces autophagy in neuroblastoma cells. a SK-N-BE(2), SH-SY5Y, and IMR-32 neuroblastoma cell lines were treated with the indicated increasing concentrations of PON or drug vehicle controls (CTRL) for 24 h. Total cell proteins were used for immunoblot analysis of the main autophagy regulators LC3, p62, and BECLIN 1. Apoptotic protein markers BCL2, total and cleaved (cl.) PARP, and cleaved (cl.) CASPASE 3 proteins were also examined. VINCULIN was used as loading control protein. The molecular weights are indicated in kilodaltons (kDa). Numbers indicate each protein/VINCULIN ratio as a fold change with respect to the controls (equal to 1) from two independent immunoblots. b Autophagy array was used to delineate the main autophagy players affected by PON in the SK-N-BE(2), SH-SY5Y, and IMR-32 cell lines. The results are normalized to internal positive controls, and the fold change is calculated with respect to the control lysates. ATG3, BECLIN 1, LC3, and MSK1 expressional changes were found in all three cell lines, while the other players differed between the examined cell lines. The data are presented as the value of the mean intensity fold change (AU). The proteins resulting in at least a 20% change are presented (p < 0.05)

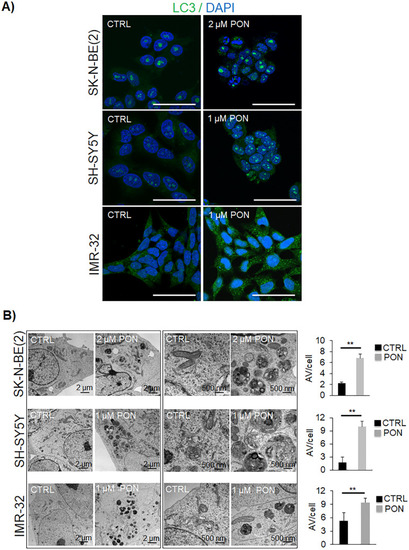
PON promotes autophagy vesicle accumulation in human neuroblastoma cells.a Tumor cells were treated with vehicle (CTRL) or PON at the indicated concentrations for 24 h. The presence of cytosolic puncta was detected through immunofluorescence analyses with LC3 antibody (green). Nuclei were counterstained with DAPI (blue). Scale bar, 50 μm. b Transmission electron microscopy images present the autophagic vacuoles (AV) in SK-N-BE(2), SH-SY5Y, and IMR-32 cells after 24 h of treatment with vehicle (CTRL) or PON. The scale bar is indicated in each image. Histograms on the right show the mean number of AVs formed per cell. **p < 0.01

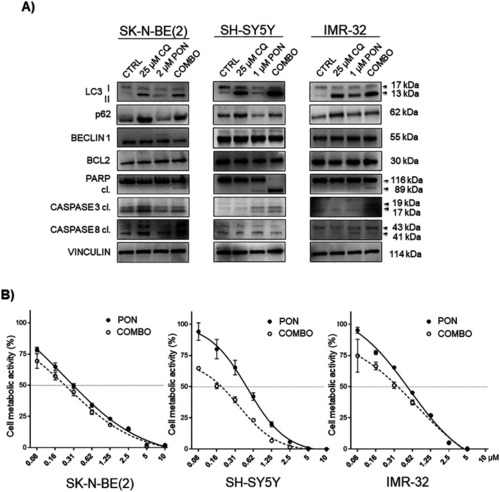
CQ interrupts PON-induced autophagy and sensitizes neuroblastoma cells to PON-dependent cytotoxicity. a Neuroblastoma cells were pre-treated with CQ for 1 h, and PON was then added for 24 h at the indicated concentrations. Total protein lysates were used for the immunoblotting analysis of the main autophagy regulators p62, LC3, and BECLIN 1. Apoptosis was assessed by means of BCL2, total and cleaved (cl.) PARP, cleaved (cl.) CASPASE 3, and CASPASE 8 proteins. VINCULIN was used as a loading control protein. The molecular weights are indicated in kilodalton (kDa). b Cell metabolic activity assay (MTT) was done in neuroblastoma cells pre-treated with 25 μM of CQ, treated with PON alone, or co-treated (COMBO) with the indicated doses (μM) of drugs for 72 h. Data are normalized to the control samples (100%). Symbols and bars represent the mean ± SEM of three independent experiments

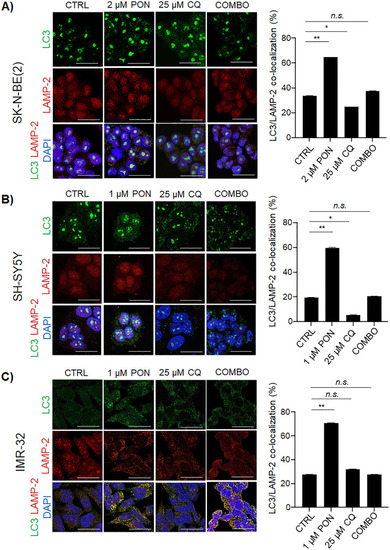
Combo therapy interferes with autophagy flux in human neuroblastoma cells. a-c Representative co-immunostaining of LC3 (green) and LAMP-2 (red) proteins are shown for the neuroblastoma cells treated according to the indicated schemes. Histograms show the percentage (%) of double-positive (yellow puncta) staining (autolysosomes). DAPI was used to counterstain nuclei. Scale bar, 100 μm. *p < 0.05; **p < 0.01; n.s. – not significant

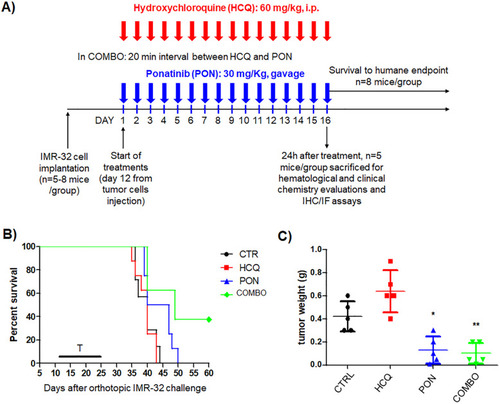
CQ potentiates PON-induced cytotoxicity in the neuroblastoma mice model. a The treatment scheme is presented. Mice (n = 8 per group) orthotopically injected with IMR-32 cells were treated every day for 16 days, as graphically represented. b Treatments (T) started 12 days after tumor cell implantation. Survival: *p < 0.05, PON vs CTRL; **p < 0.01, COMBO vs CTRL; *p < 0.05, COMBO vs PON. c IMR-32–bearing mice (n = 5 per group) were treated as above and sacrificed 24 h after the last day of treatment. *p < 0.05, PON vs CTRL; **p < 0.01, COMBO vs CTRL

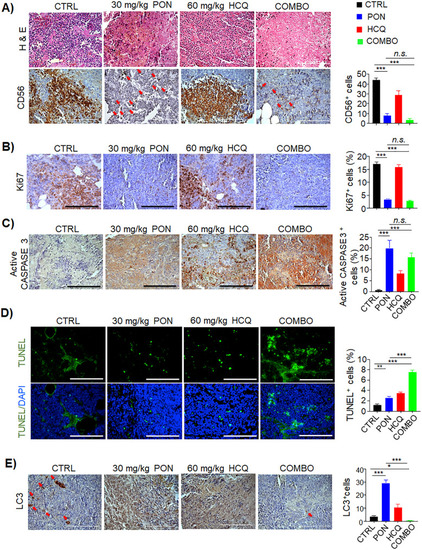
Histopathological examination of post-therapy neuroblastoma tumors confirms the efficacy of combination treatment in vivo. a Hematoxylin & Eosin (H&E) of tumor tissues and immunohistochemistry staining of CD56 proteins were carried out. Red arrows indicate positive cellular labeling. Scale bar, 150 μm. b Immunohistochemistry staining of Ki67, c active CASPASE 3, and d TUNEL assay for the detection of proliferating and apoptotic cells, respectively. The percentage (%) of positive events is reported in the histograms on the right. Scale bar, 150 μm. e Immunohistochemistry staining of LC3-positive cells in resected post-therapy tumors. Red arrows indicate positive cellular labeling. Scale bar, 150 μm. The percentage (%) of LC3-positive cells is reported in the histogram on the right. *p < 0.05, **p < 0.01, ***p < 0.001

Acknowledgments
This image is the copyrighted work of the attributed author or publisher, and ZFIN has permission only to display this image to its users. Additional permissions should be obtained from the applicable author or publisher of the image. Full text @ J. Exp. Clin. Cancer Res.