
- Title
-
The Cdx transcription factors and retinoic acid play parallel roles in antero-posterior position of the pectoral fin field during gastrulation
- Authors
- Quintanilla, C.A., Ho, R.K.
- Source
- Full text @ Mech. Dev.
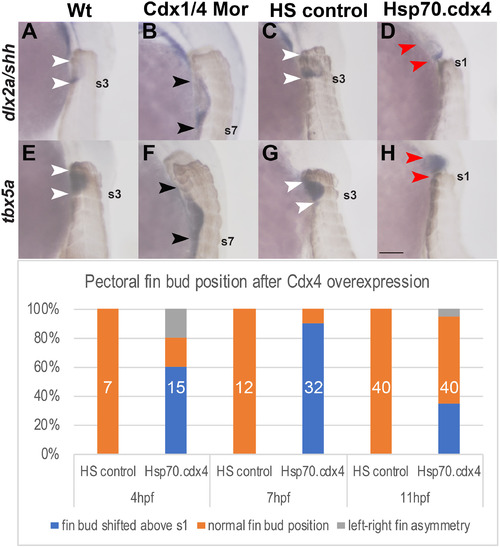
Cdx1a and Cdx4 regulate the position and size of the pectoral fin buds along the AP axis. (A–H) In situ hybridizations for the pectoral fin AER marker dlx2a (A–D), shh (A–D) and tbx5a (E–H) in lateral view at 36 hpf show caudal shift and expansion of the fin buds (B, F) as well as rostral shift of the pectoral fin bud (D, H) relative to the somites (brown). Fin buds are positioned at the level of somites 2–3 in wt (white arrowheads indicate somite level 2–3, A, E). Pectoral fin buds form at somite level 3–7 in Cdx-deficient embryos (black arrowheads in B, F indicate extent of fin buds that form adjacent to somites 3 and somite 7 (indicated as s7)). Pectoral fin buds form at somite levels 2–3 in HS controls (white arrowheads, C, G) while in Hsp70.cdx4 fish, they form rostral to the level of somite 1 (red arrowheads, D, H). (I) The frequency of rostral fin bud shifts after induced cdx4 overexpression beginning at either 4,7 or 11 hpf is indicated as % of total embryos. The corresponding numbers are: 9/15 embryos at 4 hpf, 29/32 embryos at 7 hpf and 14/40 embryos at 11 hpf. Total number of embryos used is indicated in white. Scale bar represents 100 μm. |
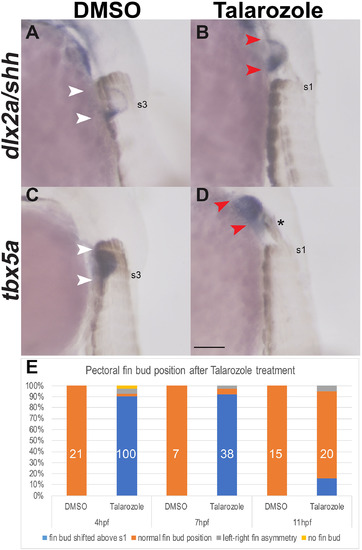
Increased levels of RA during gastrulation are sufficient to shift the pectoral fins rostrally. (A–D) In situ hybridization for the pectoral fin markers dlx2a/shh (A–B) and tbx5a (C–D) in lateral view at 36 hpf show rostral fin bud shifts relative to the somites which are marked by Myosin Heavy Chain (ectopic myosin above s1 indicated by the asterisk). Fin bud forms at the level of somites 2–3 in DMSO-treated controls (white arrowheads in A, C). Pectoral fin buds form rostral to somite level 1 in Talarozole-treated embryos (red arrowheads B, D). Somites 1 or 3 are indicated (s1 and s3, respectively). (E) The frequency of rostral fin shifts at 36 hpf after 1 h of Talarozole application beginning at either 4, 7 or 11 hpf is indicated as % of total embryos. The corresponding numbers are: 99/110 embryos at 4 hpf, 35/38 embryos at 7 hpf and 3/20 embryos at 11 hpf. Total number of embryos examined is indicated in white. Scale bar represents 100 μm. |
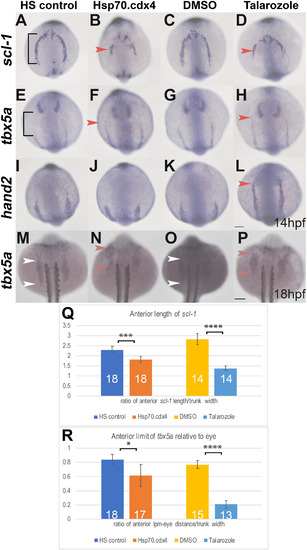
Increased RA or Cdx4 results in mis-patterning in the anterior LPM. (A–L) In situ hybridization at 14 hpf for aLPM markers scl-1 (A–D), tbx5a (E–H), and hand2 (I–L) in dorsal view. The AP length of scl-1 expression in HS controls (black bracket, A) is truncated in length in Hsp70.cdx4 (B). Compared to the expression length of scl-1 in DMSO controls (C) scl-1 expression is also truncated in Talarozole-treated embryos (red arrowhead, D). The anterior boundary of tbx5a expression in the aLPM relative to expression in the eye (black bracket, E) is shifted rostrally in Hsp70.cdx4 (red arrowhead, E), compared to HS controls (E). Expression of tbx5a in the aLPM of Talarozole-treated embryos (red arrowhead, H) is also shifted rostrally, compared to DMSO-treated controls (G). The anterior boundary of hand2 in the aLPM is unaffected between HS controls and Hsp.70.cdx4 (I, J). Expression of hand2 shifts rostrally in Talarozole-treated fish (red arrowhead, L) compared to DMSO-treated controls (K). Expression of tbx5a in the pLPM at 18 hpf is shifted rostrally in Hsp70.cdx4 embryos (red arrowhead, N) compared to HS controls (white arrowheads, M). Expression of tbx5a is also shifted rostrally in Talarozole-treated fish (red arrowhead, P) compared to DMSO-treated controls (white arrowheads, O). (Q) Quantification of the AP length of scl-1 in the aLPM normalized to the trunk width (brackets in A). (R) Quantification of the length between tbx5a expression in the aLPM and eye (bracket, E), normalized to the width of the trunk. Statistical significance was determined using the student t-test (*, p < 0.05, ***, p < 0.001, ****p < 0.0001). Scale bars represent 100 μm. |
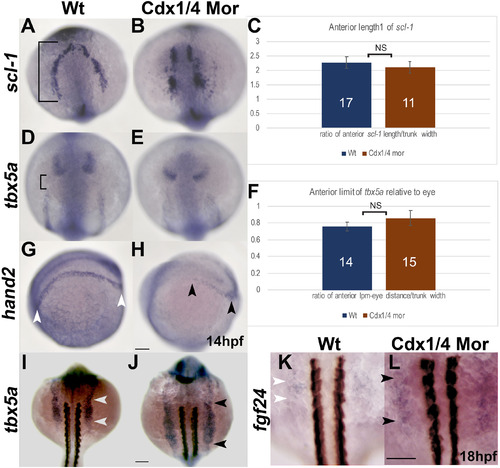
Cdx-deficient embryos have patterning defects in the pLPM. In situ hybridizations for scl-1 (A, B) tbx5a (D–E) and hand2 (G, H) at 14 hpf as well as tbx5a (I–J) and fgf24 (K, L) at 18 hpf. (A, B) Wt and Cdx-deficient embryos are comparable in the AP length of scl-1. (C) Quantification of the AP length of scl-1 (black bracket, A) normalized to the trunk width for wt and Cdx-deficient embryos. Expression of tbx5a relative to the eye is unaffected between wt and Cdx-deficient embryos (D, E). (F) Quantification of the AP length between tbx5a in the aLPM and the eye (bracket, D) shown as a ratio of the distance between the aLPM and the anterior eye, normalized to the width of the trunk, is comparable between wt and Cdx-deficient embryos. (G, H) The expression length of hand2 in the pLPM is reduced in Cdx-deficient embryos (black arrowheads, H) compared to expression in wt (white arrowheads, G). (I, J) Expression of tbx5a at 18 hpf is expanded posteriorly in the pLPM of Cdx-deficient embryos (black arrowheads, J), compared to wt (white arrowheads, I). (K, L) Expression of fgf24 at 18 hpf is expanded along the AP axis in Cdx-deficient embryos to somite levels 2–4 (black arrowheads, L) compared to wt where fgf24 is expressed at the level of somites 2–3 (white arrowheads, K). Embryos are oriented in a dorsal view (A–B, D–E, I–L) or laterally with the anterior end towards the left (G-H). Non-significant differences in the quantitative analysis are indicated as NS. Scale bars represent 100 μm. |
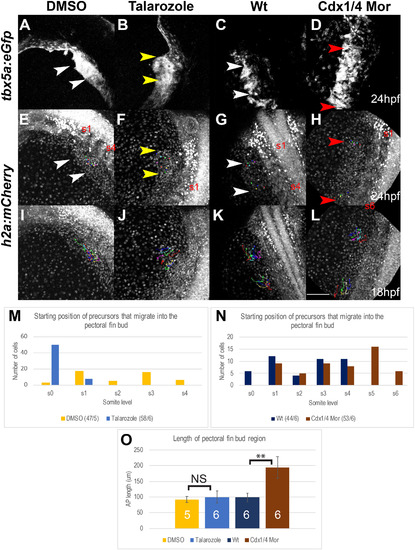
A subpopulation of Tbx5a-positive cells fails to migrate from the pLPM to the pectoral fin bud in Cdx-deficient embryos. (A–L) Maximum Intensity Projections (MIPs) of live-imaged Tg(tbx5a:eGFP), Tg(h2afx:h2afv-mCherry)mw3 double transgenic embryos, oriented dorsally. The fin field cells that completed migration into the fin bud region are indicated by the arrowheads in Tg(tbx5a:eGFP) (A–D) and Tg(h2afx:h2afv-mCherry)mw3 (E–H) embryos at 24 hpf. Cells that were backtracked beginning at 24 hpf are indicated by the colored dots (E–H). The tracks for the selected cells are indicated by colored lines in Tg(h2afx:h2afv-mCherry)mw3 embryos at 18 hpf (I–L). The fin bud region at 24 hpf is shown for wt (white arrowheads, A, E), Cdx-deficient (red arrowheads, B, F), DMSO-treated (white arrowheads, C, G), and Talarozole-treated (yellow arrowhead, D, H). The somite level of the anterior and posterior fin bud region is indicated (either s1 and s4 or s1 and s6). The somite level that Tbx5a-positive cells of the fin bud originated from at 18 hpf are quantified for DMSO and Talarozole-treated embryos (M) or for wt and Cdx-deficient embryos (N). The number of cells tracked/the number of embryos used is indicated per condition as a fraction at the bottom of tables M–N. (O) Quantification of the length of the fin bud region at 28 hpf for DMSO (yellow), Talarozole (blue), Wt (navy blue) and Cdx-deficient (brown). Statistical significance was determined using the student t-test (**, p < 0.01) Non-significant differences are indicated as NS. Scale bar represents 100 μm. |
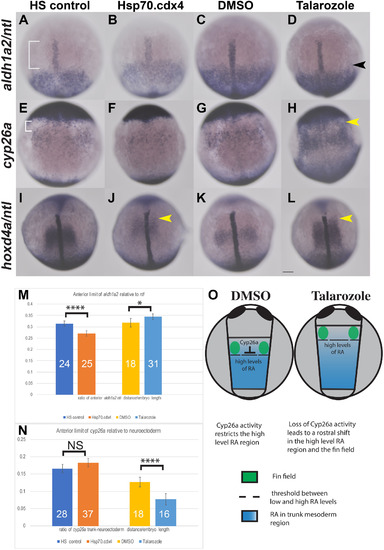
Overexpression of Cdx4 results in different effects on gene expression compared to increased RA. In situ hybridization for aldh1a2 (A–D) shows the anterior boundary of expression relative to expression of ntl in the notochord (white bracket, A) shifts rostrally in Hsp70.cdx4 (B) compared to HS controls (A). Aldh1a2 expression shifts caudally in Talarozole-treated embryos (black arrowhead, D) compared to DMSO-treated controls (C). The distance between the rostral boundary of aldh1a2 and ntl expression was quantified and normalized relative to the yolk diameter in M. (E–H) Expression of cyp26a in trunk mesoderm relative to the anterior neuroectoderm is unaffected in Hsp70.cdx4 (F) compared to HS controls (white bracket, E). Cyp26a expression the trunk mesoderm of Talarozole-treated fish (H) is upregulated and shifted rostrally compared to DMSO-treated controls (G). The distance between expression in the trunk mesoderm and neuroectoderm was quantified in N (white bracket in E). (I–L) Expression of hoxd4a is shown relative to ntl expression and rostral shifts are indicated by yellow arrowheads (J, L). (O) Diagram of the presumed RA distribution (blue) relative to Cyp26a and the fin field (green) in DMSO and Talarozole-treated embryos at the tailbud stage. The threshold between high and low levels of RA is indicated by dashed lines. Embryos are shown in dorsal view with anterior towards the top. Statistical significance was calculated using student t-test (*, p < 0.05, ****, p < 0.00001). Non-significant differences are indicated NS. Scale bar represents 100 μm. |
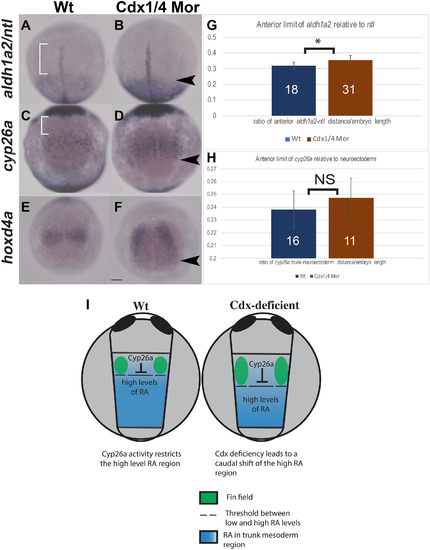
Cdx-deficiency results in a caudal shift in aldh1a2 expression as well as a caudal expansion of cyp26a and hoxd4a at the tailbud stage (A–F). In situ hybridization for aldh1a2 (A–B), cyp26a (C–D), at the tailbud stage and hoxd4a at 1-2ss (E–F). Expression of aldh1a2 relative to the notochord shifts caudally in Cdx-deficient embryos (black arrowhead, B), compared to wt (white brackets, A). The length between the anterior boundary of aldh1a2 and the notochord (white brackets) was quantified and normalized to the yolk diameter (G). Expression of cyp26a in the trunk mesoderm was compared relative to expression in the anterior neuroectoderm (C, D). The rostral boundary of cyp26a in the trunk was unaffected in Cdx-deficient embryos (D) compared to wt (C), although the posterior boundary of cyp26a expanded caudally. The length between cyp26a in the trunk mesoderm and neuroectoderm (white bracket in C) was quantified and normalized to the yolk diameter (H) and no significant differences were observed. Expression of hoxd4a expanded caudally in Cdx-deficient embryos (black arrowhead, F), compared to wt (E). (I) Diagram of the presumed RA distribution (blue) relative to Cyp26a and the fin field (green) in wt and Cdx-deficient embryos at the tailbud stage. Embryos are shown in dorsal view, anterior to the top and dashed lines indicate the threshold between low and high levels of RA. Statistical significance was calculated by using the student t-test, (*, p < 0.05). Non-significant differences are indicated as NS. Scale bar represents 100 μm. |
Reprinted from Mechanisms of Development, 164, Quintanilla, C.A., Ho, R.K., The Cdx transcription factors and retinoic acid play parallel roles in antero-posterior position of the pectoral fin field during gastrulation, 103644, Copyright (2020) with permission from Elsevier. Full text @ Mech. Dev.