
- Title
-
α-Synuclein amplifies cytoplasmic peroxide flux and oxidative stress provoked by mitochondrial inhibitors in CNS dopaminergic neurons in vivo
- Authors
- Van Laar, V.S., Chen, J., Zharikov, A.D., Bai, Q., Di Maio, R., Dukes, A.A., Hastings, T.G., Watkins, S.C., Greenamyre, J.T., St Croix, C.M., Burton, E.A.
- Source
- Full text @ Redox Biol.
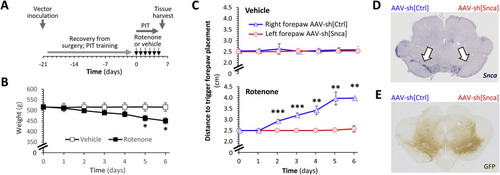
Fig. 1. α-Synuclein knockdown prevents rotenone-induced loss of dopaminergic function in vivo. A: Schematic depiction of the experimental sequence for the rat studies shown in panels B–E and in Fig. 2. B: Mean ± SE weight of rats treated with vehicle (white squares) or rotenone (2.8 mg/kg/day; black squares) by intraperitoneal injection over 6 consecutive days. p < *0.05 vehicle versus rotenone, 2-way repeated measures ANOVA with Šidák multiple comparisons test. C: Mean ± SE distance to trigger a corrective forelimb movement during postural instability tests in rats treated with vehicle (upper panel) or rotenone (lower panel). In each case, data are shown separately for the left forelimb (red; opposite to right hemisphere that received AAV-sh[Snca]) and right forelimb (blue; opposite the left hemisphere that received AAV-sh[Ctrl]). p < **0.01, **0.001, left vs. right, 2-way repeated measures ANOVA with Šidák multiple comparisons test. D, E: Micrographs showing midbrain sections from a vehicle-treated rat, labeled using (D) RNA in situ hybridization to detect the Snca mRNA transcript (purple) or (E) immunohistochemistry to detect expression of GFP (brown). Arrows in the upper panel indicate the substantia nigra. The side of the brain that received each vector is marked above the sections. |
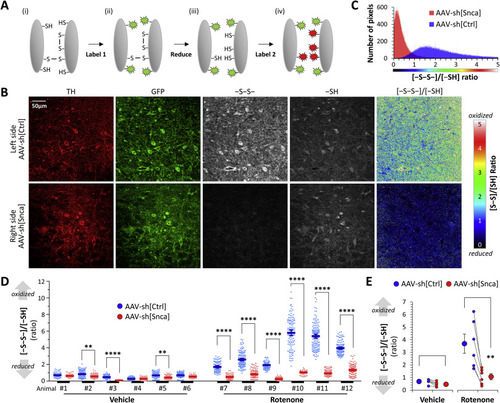
Fig. 2. α-Synuclein knockdown mitigates rotenone-induced thiol oxidation in dopaminergic neurons in vivo. A: Schematic illustration of the thiol histochemical method used in panels B–E. Reduced thiol groups were irreversibly labeled with a maleimide-conjugate fluorophore. Disulfide bonds were then reduced and the resulting newly-generated thiols labeled with maleimide conjugated to a second fluorophore. The relative signal intensity of the two fluorophores was determined by confocal microscopy, providing a map of thiol oxidation in the tissue sample. B: Confocal micrographs of a midbrain section from a rat that received AAV-sh[Ctrl] in the left substantia nigra (top row) and AAV-sh[Snca] in the right substantial nigra (bottom row), followed by 6 days of rotenone (see Fig. 1A). The images show: immunofluorescence for tyrosine hydroxylase (TH; red); immunofluorescence for GFP (green); oxidized thiols (-S-S-; grayscale); reduced thiols (-SH; grayscale). The final column shows the ratiometric image for oxidized/reduced thiols, pseudocolored according to the scale shown to the right of the panel. C: Histogram showing the frequency distribution of the oxidized/reduced thiol ratio in each pixel of the images shown in panel B. D: Scatterplots showing thiol oxidation, analyzed in dopaminergic neurons on both the left (AAV-sh[Ctrl]; blue) and right (AAV-sh[Snca]; red) sides of the substantia nigra in 6 vehicle (animals #1 - #6) and 6 rotenone (animals #7 - #12) treated rats. Data points show the mean oxidized/reduced thiol ratio in individual dopaminergic neurons, bars show mean ± SE for each side of each animal. p <**0.01, ****0.0001, left vs. right, 1-way ANOVA with Tukey multiple comparisons test. E: Mean dopaminergic neuron thiol oxidation is shown for the two sides of the midbrain in each animal (small markers; the two sides of each animal are connected by a line) alongside mean ± SE for all six animals in each group (large markers). p < 0.01**, left vs. right, 2-tailed paired t-test. |
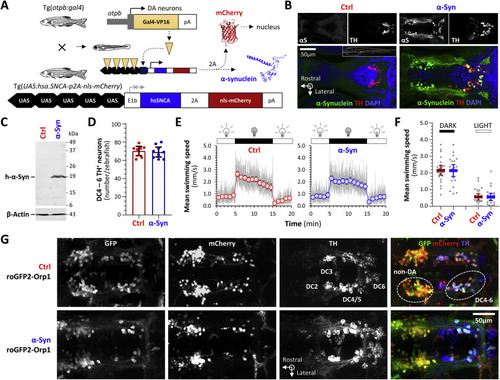
Fig. 3. Transgenic zebrafish expressing human α-Synuclein and a ratiometric biosensor of cytoplasmic peroxide in dopaminergic neurons in vivo. A: Schematic depiction of the transgene constructs and breeding scheme used to express human α-Synuclein in ventral diencephalic dopaminergic neurons of larval zebrafish. For brevity, roy−/−; nacre−/−; Tg(optb:gal4); Tg(UAS:hsa.SNCA-p2A-nls-mCherry) larvae, which express human α-Synuclein and nuclear-localized mCherry as separate proteins on a transparent genetic background lacking pigment, are referred to as “α-Syn” zebrafish. Control roy−/−; nacre−/−; Tg(optb:gal4); Tg(UAS:nls-mCherry) larvae, which lack an α-Synuclein transgene from the UAS responder cassette but are otherwise isogenic, are referred to as “Ctrl” zebrafish. B: Confocal single-plane images of histological sections from the diencephalon of Ctrl (left) and α-Syn (right) zebrafish, labeled by immunofluorescence for human α-Synuclein (αS) and tyrosine hydroxylase (TH). The pseudocolored overlaid images are shown with a nuclear counter label (α-Synuclein, green; TH, red; DAPI, blue). The plane of the sections is shown by the dotted yellow line in the inset panel for the Ctrl sample. C: Western blot of pooled head region lysates from Ctrl (left lane) and α-Syn (right lane; n = 24 larvae per lane) zebrafish, probed with an antibody to human α-Synuclein (upper panel) and β-Actin as a loading control (lower panel). The positions of molecular weight markers are shown to the right of the blot image. D: Exhaustive counts of TH-expressing dopaminergic neurons in diencephalic groups DC4 – 6 from Ctrl (red; n = 8) and α-Syn (blue; n = 9) larvae at 5dpf. Data points show values from single zebrafish; bars show mean ± SE. There was no significant difference between Ctrl and α-Syn zebrafish. E: Swimming movements of Ctrl (red, left graph) and α-Syn (blue, right graph; n = 24 each group) larvae at 5dpf were recorded by infrared videography (4 frames/s) in response to cycles of 10 min bright ambient light (white, 200 Lux) followed by 10 min darkness (visual motor response, VMR; ambient illumination is indicated above each graph). Video tracking software was used to quantify larval displacements at frame transitions and responses were averaged over 3 light-dark cycles. The grey traces show mean frame-to-frame displacements scaled to represent mean instantaneous swimming speed in mm.s−1. The markers and bars show mean swimming speed ± SE for each 1-min time bin. F: Scatter plots showing mean swimming speed during the dark (left) and light (right) phases of the VMR for each zebrafish. Bars show mean ± SE (n = 24 larvae per group). Although there were robust responses to changes in illumination, there were no significant differences between Ctrl and α-Syn zebrafish. G: Confocal z-plane projections of the diencephalic region of fixed, whole mount Ctrl; roGFP2-Orp1 (upper row) and α-Syn; roGFP2-Orp1 (lower row) zebrafish labeled with antibodies to GFP, mCherry and tyrosine hydroxylase. The overlaid images are shown in the right column (GFP, green; mCherry, red; TH, blue). Groups of TH-expressing diencephalic dopaminergic neurons that also express the otpb enhancer element used in the driver line are numbered in the Ctrl TH image. The Ctrl overlay image indicates the locations of the DC 4–6 dopaminergic neurons imaged in live zebrafish in Figs. 4–10 and a more rostral group of non-dopaminergic (non-DA) neurons that also expresses the otpb enhancer and was imaged for comparison. PHENOTYPE:
|
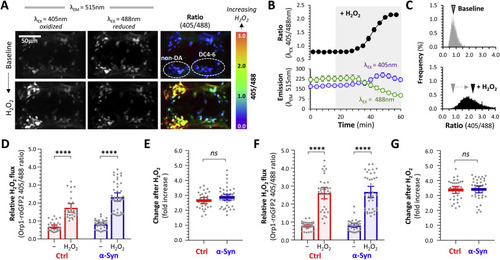
Fig. 4. Dynamic measurement of cytoplasmic H2O2 flux in dopaminergic neurons in vivo. A: Intravital confocal microscopy was used to image the roGFP2-Orp1 biosensor in the ventral diencephalon of a live α-Syn; roGFP2-Orp1 zebrafish. Emission was captured at 515 nm following serial excitation at 405 nm (left column) and 488 nm (center column). The ratiometric image (right column; color scale shown to the right), calculated by dividing each image plane of the 405 nm dataset by the corresponding 488 nm image plane, shows relative integrated H2O2 flux. The positions of dopaminergic DC4 – 6 and adjacent non-dopaminergic neuronal groups are shown. The top row of images shows baseline steady-state images after equilibration in the imaging apparatus; the bottom row shows images of the same zebrafish after application of 3 mM H2O2 to the bath. B: Unbiased 3D spot detection was used to define regions corresponding to cells within the DC4 – 6 cluster. Within each cell, mean emission following excitation at 405 nm or 488 nm (bottom graph) and the 405/488 ratio (top graph) was calculated in serial images acquired every 4 min for 1 h. Each datapoint shows mean ± SE (n = 9 neurons). After stable baseline data were collected, HH2O2 was added to the bath at t = 18 min (shaded area). C: Ratiometric histograms showing the frequency distribution of the roGFP2-Orp1 405/488 ratio from every pixel within areas corresponding to DC4 – 6 dopaminergic neurons in 2D images, at baseline (top panel) and after addition of H2O2 to the bath (bottom panel). The arrowhead shows the mean of each distribution. D: Scatterplots showing baseline and peak roGFP2-Orp1 405/488 ratio, calculated using the 3D method, in DC4 – 6 dopaminergic neurons following exposure to H2O2. Data points represent individual neurons (Ctrl n = 29; α-Syn n = 45 neurons, combined from 4 replicate zebrafish); bars show mean ± SE; p < 0.0001****, 2-way ANOVA with Tukey multiple comparisons test. E: Scatterplot showing fold increase in roGFP2-Orp1 405/488 ratio between baseline and post-H2O2 peak for each individual cell from panel D. Bars show mean ± SE; p = 0.12, 2-tailed unpaired t-test. F: Baseline and peak roGFP2-Orp1 405/488 ratio in non-dopaminergic diencephalic neurons following exposure to H2O2. Data points, bars, and analysis identical to panel D (Ctrl n = 34; α-Syn n = 38 neurons). G: Fold increase in roGFP2-Orp1 405/488 ratio between baseline and post-H2O2 is shown for each individual cell from panel F. Bars show mean ± SE; p = 0.54, 2-tailed unpaired t-test. |
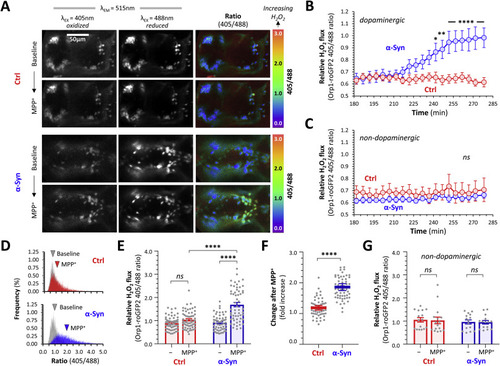
Fig. 5. α-Synuclein increases cytoplasmic peroxide flux in dopaminergic neurons exposed to MPP+. A: Intravital confocal microscopy was used to image the roGFP2-Orp1 biosensor dynamically in the ventral diencephalon of live Ctrl; roGFP2-Orp1 (upper six panels) and α-Syn; roGFP2-Orp1 (lower six panels) zebrafish, at baseline (upper row of each set) and following exposure to MPP+ (lower row of each set; 3 mM final bath concentration). Emission at 515 nm following excitation at 405 nm and 488 nm respectively are shown in the first two columns and the ratiometric 405/488 images (color scale to right of images) in the third column of each set. B, C: Using the unbiased 3D spot detection method, the roGFP2-Orp1 405/488 ratio was calculated for (C) dopaminergic DC4 – 6 neurons (n = 7 to 8) and (D) adjacent non-dopaminergic neurons (n = 6 to 8), in serial images acquired every ≈5 min over 5 h. After stable baseline data were collected, MPP+ was added to the bath; the x-axis shows time after addition of MPP+. Each data point shows mean ± SE; p < 0.05*, 0.01**, 0.0001**** Ctrl vs. α-Syn at same time point, 2-way repeated measures ANOVA with Šidák multiple comparisons test. D: Ratiometric histograms showing the frequency distribution of the 405/488 ratio from every pixel within areas corresponding to DC4 – 6 dopaminergic neurons on 2D images at baseline (grey) and t = 280 min after addition of MPP+ for Ctrl (red) and α-Syn (blue) zebrafish. The arrowheads show the mean of each distribution. E: Scatterplot showing roGFP2-Orp1 405/488 ratio calculated using the 3D method, in DC4 – 6 dopaminergic neurons from Ctrl (blue) and α-Syn (red) zebrafish, at baseline and following exposure to MPP+. Data points represent individual neurons (Ctrl n = 57; α-Syn n = 59 neurons, combined from 4 replicate zebrafish); bars show mean ± SE; p < 0.001**, 0.0001****, 2-way ANOVA with Tukey multiple comparison test. F: Scatterplot showing fold increase in roGFP2-Orp1 405/488 ratio between baseline and post-MPP+ exposure for each individual cell shown in panel E. Bars show mean ± SE; p < 10−15 ****, 2-tailed unpaired t-test. G: Scatterplot showing baseline and peak roGFP2-Orp1 405/488 ratio in non-dopaminergic diencephalic neurons following exposure to MPP+, from the same zebrafish analyzed in panel E (n = 16 neurons per group). Data points, bars, and analysis identical to panel E. PHENOTYPE:
|
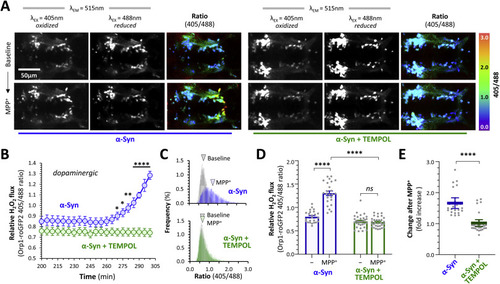
Fig. 6. TEMPOL prevents α-Synuclein-dependent cytoplasmic peroxide flux in dopaminergic neurons exposed to MPP+. A: Intravital confocal microscopy was used to image the roGFP2-Orp1 biosensor dynamically in the ventral diencephalon of live α-Syn; roGFP2-Orp1 zebrafish, following pretreatment with embryo water only (left six panels) or TEMPOL (3 mM in embryo water; right six panels), at baseline and following exposure to MPP+ (3 mM final bath concentration). Emission at 515 nm following excitation at 405 nm and 488 nm respectively are shown in the first two columns and the ratiometric 405/488 images (color scale to right of images) in the third column of each image set. B: Unbiased 3D spot detection was used to calculate the roGFP2-Orp1 405/488 ratio in dopaminergic DC4 – 6 neurons (n = 5 per group) in serial images acquired over 5 h after addition of MPP+ to the bath (x axis shows time after addition of MPP+). Mean ± SE roGFP2-Orp1 405/488 ratio is shown for neurons from α-Syn; Orp1-roGFP2 zebrafish that were pretreated with water only (blue) or TEMPOL (green). P < 0.05*, 0.01**, 0.0001**** water vs. TEMPOL at same time point, 2-way repeated measures ANOVA with Šidák multiple comparisons test. C: Ratiometric histograms showing the frequency distribution of the roGFP2-Orp1 405/488 ratio from every pixel within areas corresponding to DC4 – 6 dopaminergic neurons on 2D images at baseline (grey) and t = 300 min after addition of MPP+ for α-Syn zebrafish pretreated with water (blue) or TEMPOL (green). The arrowheads show the mean of each distribution. D: Scatterplot showing roGFP2-Orp1 405/488 ratio calculated using the 3D method in DC4 – 6 dopaminergic neurons from α-Syn zebrafish pre-treated with water (blue; n = 24) or TEMPOL (green; n = 31 neurons), at baseline and following exposure to MPP+. Data points represent individual neurons combined from 4 replicate zebrafish in each group; bars show mean ± SE; p < 0.0001****, 2-way ANOVA with Tukey multiple comparison test. E: Scatterplot showing fold increase in roGFP2-Orp1 405/488 ratio between baseline and post-MPP+ exposure for each individual cell shown in panel D. Bars show mean ± SE; p < 0.0001****, 2-tailed unpaired t-test. |
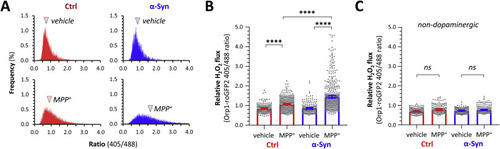
Fig. 7. α-Synuclein enhances cytoplasmic peroxide flux in dopaminergic neurons during prolonged MPP+ exposure. Ctrl; roGFP2-Orp1 (red) and α-Syn; roGFP2-Orp1 (blue) zebrafish were exposed to vehicle (embryo water only) or MPP+ (0.5 mM bath concentration) for 16 h and then the ro-GFP2-Orp1 biosensor imaged in live intact larvae at a single time point. Emission at 515 nm following sequential excitation at 405 nm and 488 nm was recorded as shown in Fig. 4, Fig. 5, Fig. 6. A: Histograms showing the frequency distribution of the ro-GFP2-Orp1 405/488 ratio from every pixel within areas corresponding to DC4 – 6 dopaminergic neurons within 2D images from Ctrl (red, left column) and α-Syn (right, blue) zebrafish exposed to vehicle (upper row) or MPP+ (lower row). The arrowheads show the mean of each distribution. B, C: Scatterplots showing roGFP2-Orp1 405/488 ratio calculated from 3D image analysis, in (B) DC4 – 6 dopaminergic neurons and (C) adjacent non-dopaminergic neurons, from Ctrl (red) and α-Syn (blue) zebrafish exposed to vehicle or MPP+ for 16 h. Data points represent individual neurons (dopaminergic: Ctrl vehicle n = 181; Ctrl MPP+ n = 379; α-Syn vehicle n = 210; α-Syn MPP+ n = 470; non-dopaminergic: Ctrl vehicle n = 208; Ctrl MPP+ n = 156; α-Syn vehicle n = 254; α-Syn MPP+ n = 225 neurons, combined from 10 to 13 replicate zebrafish in each group); bars show mean ± SE; p < 0.0001****, 1-way ANOVA with Tukey multiple comparisons test. PHENOTYPE:
|
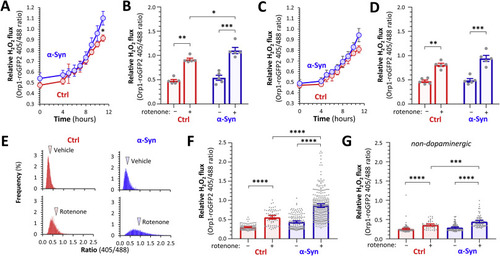
Fig. 8 Download : Download high-res image (721KB)Download : Download full-size image Fig. 8. α-Synuclein enhances cytoplasmic peroxide flux in dopaminergic neurons following rotenone exposure. A – D: The roGFP2-Orp1 biosensor was imaged by intravital confocal microscopy in the ventral diencephalon of live Ctrl; roGFP2-Orp1 (red) and α-Syn; roGFP2-Orp1 (blue) zebrafish, at baseline and serially for 11 h after addition of rotenone to the bath (80 nM final concentration). 3D ratiometric analyses are shown for (A, B) DC4 – 6 dopaminergic neurons and (C, D) adjacent non-dopaminergic neurons (n = 5 neurons in each group). (A) and (C) show mean ± SE roGFP2-Orp1 405/488 ratio at each time point; p < 0.05* α-Syn vs. Ctrl at same time point, 2-way repeated measures ANOVA with Šidák multiple comparisons test. (B) and (D) show baseline and final roGFP2-Orp1 405/488 ratio; data points show individual neurons, bars show mean ± SE; p < 0.05*, 0.01**, 0.001***, 2-way ANOVA with Tukey multiple comparisons test. E – G: Ctrl; roGFP2-Orp1 (red) and α-Syn; roGFP2-Orp1 (blue) zebrafish were exposed to vehicle or rotenone (80 nM bath concentration) for 16 h and then the roGFP2-Orp1 imaged in live intact larvae by intravital confocal microscopy at a single time point. (E) Frequency distribution histograms from pixel-by-pixel 2D ratiometric analyses of DC4 – 6 dopaminergic neurons in vehicle-exposed (upper row) compared with rotenone-exposed (lower row) zebrafish. Arrowheads show the mean of each distribution. (F, G) 3D analysis of roGFP2-Orp1 405/488 ratios for (F) dopaminergic and (G) non-dopaminergic neurons. Data points show individual neurons (dopaminergic: Ctrl vehicle n = 107; Ctrl rotenone n = 66; α-Syn vehicle n = 154; α-Syn rotenone n = 304; non-dopaminergic: Ctrl vehicle n = 111; Ctrl rotenone n = 46; α-Syn vehicle n = 117; α-Syn rotenone n = 80 neurons, combined from 7 to 11 replicate zebrafish in each group); bars show mean ± SE; p < 0.05*, 0.0001****, 1-way ANOVA with Tukey multiple comparisons test. |
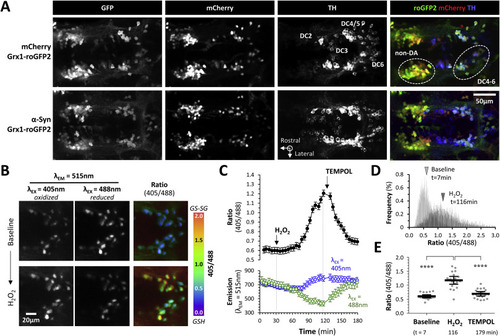
Fig. 9. Transgenic zebrafish expressing human α-Synuclein and a ratiometric biosensor of glutathione oxidation in dopaminergic neurons in vivo. A: Confocal z-plane projections of fixed, whole mount Ctrl; Grx1-roGFP2 (upper row) and α-Syn; Grx1-roGFP2 (lower row) zebrafish labeled with antibodies to GFP, mCherry and tyrosine hydroxylase. The overlaid images are shown in the right column (GFP, green; mCherry, red; TH, blue). Groups of TH-expressing diencephalic dopaminergic neurons that also express the otpb enhancer element used in the driver line are numbered in the Ctrl TH image. The Ctrl overlay image indicates the locations of the DC 4–6 dopaminergic neurons imaged in live zebrafish in Fig. 10 and a more rostral group of non-dopaminergic neurons (non-DA) that also expresses the otpb enhancer and was imaged for comparison. B: Intravital confocal microscopy was used to image the Grx1-roGFP2 biosensor in the ventral diencephalon of an α-Syn; Grx1-roGFP2 zebrafish. Emission was captured at 515 nm following serial excitation at 405 nm (left column) and 488 nm (center column). The ratiometric image (right column; color scale shown to the right), calculated by dividing each image plane of the 405 nm dataset by the corresponding 488 nm image plane, shows the relative glutathione redox potential. The images show the dopaminergic DC4 – 6 neuronal groups; the top row shows baseline steady-state images and the bottom row shows images of the same zebrafish after application of 3 mM H2O2 to the bath. C: Unbiased 3D spot detection was used to quantify emission at 515 nm within DC4 – 6 dopaminergic neurons, following sequential excitation at 405 nm or 488 nm (bottom graph) and to calculate the 405/488 ratio (top graph) in serial images acquired every 4 min for 1 h. Each datapoint shows mean ± SE (n = 19 neurons). After stable baseline data were collected, H2O2 was added to the bath at t = 30 min and then H2O2 was removed and TEMPOL added to the bath at 120 min (arrows). D: Ratiometric histograms showing the frequency distribution of the Grx1-roGFP2 405/488 ratio from every pixel within areas corresponding to DC4 – 6 dopaminergic neurons in 2D images, at baseline (top panel) and after addition of H2O2 to the bath (bottom panel). The arrowheads show the mean of each distribution. E: Scatterplots showing baseline, peak and final Grx1-roGFP2 405/488 ratio in DC4 – 6 dopaminergic neurons following sequential exposure to H2O2 and TEMPOL. Data points represent individual neurons combined from 4 separate zebrafish; bars show mean ± SE; p < 0.0001****, 1-way ANOVA with Tukey multiple comparison test. |
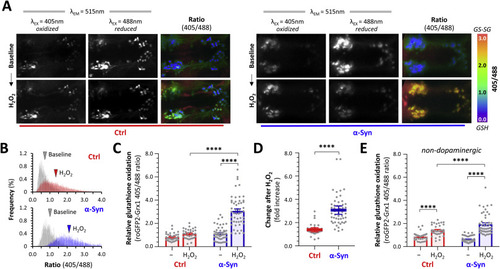
Fig. 10. α-Synuclein enhances H2O2-induced glutathione oxidation in dopaminergic neurons in vivo. A: Intravital confocal microscopy was used to image the Grx1-roGFP2 biosensor in the ventral diencephalon of live Ctrl; Grx1-roGFP2 (left six images) and α-Syn; Grx1-roGFP2 (right six images) zebrafish. Emission was captured at 515 nm following serial excitation at 405 nm (left column of each set) and 488 nm (center column of each set). The ratiometric image (right column of each set; color scale shown to the right), calculated by dividing each image plane of the 405 nm dataset by the corresponding 488 nm image plane, shows relative glutathione redox potential. The top row of images shows baseline steady-state images; the bottom row shows images of the same zebrafish after application of 3 mM H2O2 to the bath. B: Ratiometric histograms showing the frequency distribution of the Grx1-roGFP2 405/488 ratio from every pixel within areas corresponding to DC4 – 6 dopaminergic neurons in 2D images, in Ctrl (top panel) and α-Syn zebrafish (bottom panel), at baseline (gray) and after H2O2 exposure (colored). The arrowheads show the mean of each distribution. C: Scatterplot showing Grx1-roGFP2 405/488 ratio calculated using the 3D method, in DC4 – 6 dopaminergic neurons, at baseline and following exposure to H2O2. Data points represent individual neurons (Ctrl n = 33; α-Syn n = 51 neurons, combined from 4 replicate zebrafish in each group); bars show mean ± SE; p < 0.01**, 0.0001****, 2-way ANOVA with Tukey multiple comparison test. D: Scatterplot showing fold increase in Grx1-roGFP2 405/488 ratio between baseline and post-H2O2 peak for each individual cell from panel C. Bars show mean ± SE; p < 10−10 ****, 2-tailed unpaired t-test. E: Scatterplot showing Grx1-roGFP2 405/488 ratio calculated using the 3D method, in non-dopaminergic neurons following exposure to H2O2. Data points represent individual neurons (Ctrl n = 35; α-Syn n = 49 neurons, combined from 4 replicate zebrafish in each group); bars show mean ± SE; p < 0.01**, 0.0001****, 2-way ANOVA with Tukey multiple comparisons test. PHENOTYPE:
|