
- Title
-
A nontoxic fungal natural product modulates fin regeneration in zebrafish larvae upstream of FGF-WNT developmental signaling
- Authors
- Cavanah, P., Itou, J., Rusman, Y., Tahara, N., Williams, J.M., Salomon, C.E., Kawakami, Y.
- Source
- Full text @ Dev. Dyn.
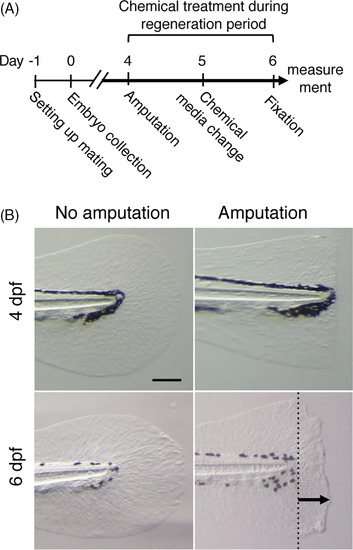
Zebrafish larvae fin regeneration assay system. A, Schematic of experimental design from setting up mating to sample fixation at 6 dpf. B, Caudal fin images at 4dpf and 6 dpf with and without amputation at 4dpf. Dotted line in the lower right panel indicates the amputation plane. The arrow in the lower right panel indicates a maximum regenerated length. Scale bar, 150 μm |
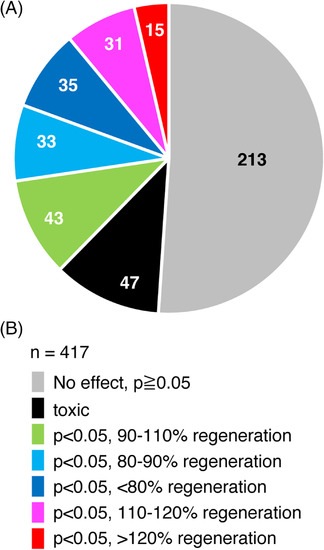
Summary of larvae fin regeneration screening. A, Summary of experiments with 429 unique compounds/extracts are shown as a pie chart. The number in each fraction shows the number of fractions or purified compounds. B, Color‐coding of the results shown in A |
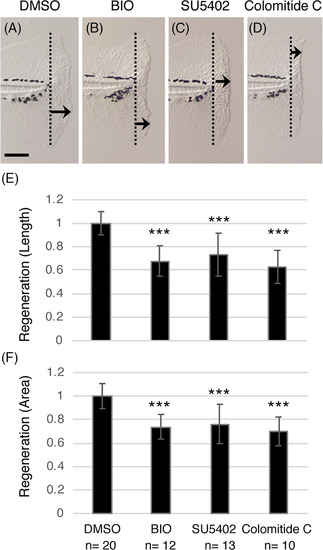
Colomitide C inhibits zebrafish larvae fin regeneration. A‐D, Images of larvae fin 2 days after amputation. Larvae were treated with indicated chemicals. Dotted lines indicate the amputation plane. Arrows indicate the maximum regenerated length in each image. Scale bar, 100 μm. E and F, Graphic presentation of maximum regenerated length (E) and total area of regenerated fin (F). Values are normalized using the average value of DMSO‐treated fin as 1.0. ** P < .01, *** P < .001 by t‐test |
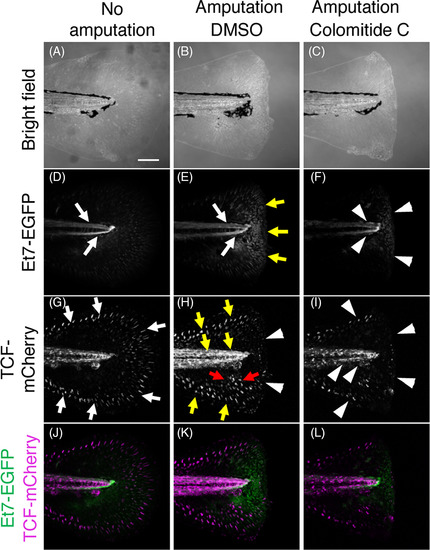
Colomitide C modulates FGF and WNT signaling during larvae fin regeneration. Images of 6 dpf larvae fin without amputation (A, D, G, J). Images of 6 dpf larvae fin, amputated at 4dpf (B, C, E, F, H, I, K, L). Larvae in the middle and right column are treated with DMSO and colomitide C, respectively. A‐C, Bright filed image. D‐F, Et7‐EGFP signals, shown in black/white. G‐I, TCF‐mCherry signals, shown in black/white. J‐L, Merged images of Et7‐EGFP signals (green) and TCF‐mCherry signals (magenta) |
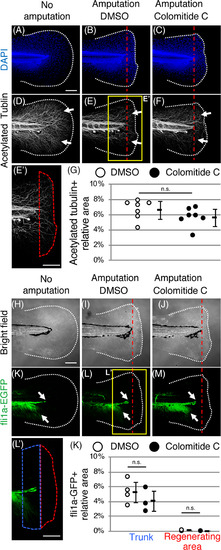
Colomitide C does not affect density of nerve and endothelial cells during larvae fin regeneration. Images of 6 dpf larvae fin without amputation (A, D). Images of 6 dpf larvae fin, amputated at 4dpf (B, C, E, F). Larvae in the middle and right column are treated with DMSO and colomitide C, respectively. DAPI (A‐C) and acetylated tubulin (D‐F) signals after whole‐mount immunostaining. Tail fin without amputation (A, D), with amputation and DMSO‐treatment (B, E, E'), and with amputation and colomitide C‐treatment (C, F) are shown. E' shows a closeup indicated in E. Red dotted area in E' show the regenerating fin. (G) Relative density of the nerve in the regenerating fin.. n.s., not significant by t‐test. Bright field images (H‐J) and fli1a‐GFP signals (K‐M) of the tail fin without amputation (H, K), with amputation and DMSO‐treatment (I, L, L'), and with amputation and colomitide C‐treatment (J, M). L' shows a closeup indicated in L. Red dotted area and blue dotted area in L' show the regenerating fin and the trunk area 100 μm from the amputation plane, respectively. (K) Relative density of endothelial cells in the trunk and regenerating fin. n.s., not significant by t‐test. White dotted lines and red dotted straight lines indicate the amputation plane, respectively. A‐F and H‐M are at the same scale. Scale bar in A, E', H and L', 100 μm |
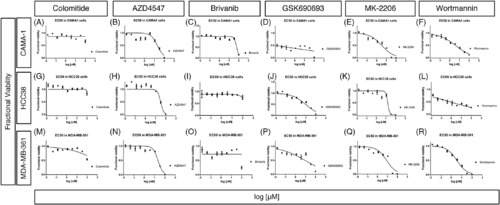
Cytotoxicity assay results after treating breast cancer cells lines for 24 hours. Dose‐dependent cytotoxicity assay results after treating CAMA‐1 (A‐F), HCC38 (G‐L) and MDA‐MB‐361 (M‐R) cell lines for 24 hours. Colomitide C (A, G,M), ZAD4547 (B, H, N), Brivanib (C, I, O), GSK690693 (D,J,P), MK‐2206 (E, K, Q) and Wortmannin (F, L, R) were used. The x axis represents concentration of chemicals in log10 scale and the y axis represents fractional viability |
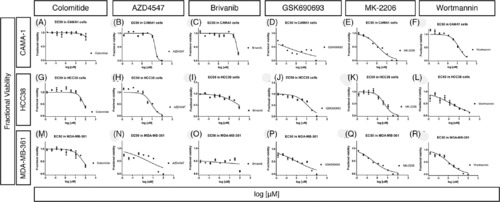
Cytotoxicity assay results after treating breast cancer cells lines for 48 hours. Dose‐dependent cytotoxicity assay results after treating CAMA‐1 (A‐F), HCC38 (G‐L) and MDA‐MB‐361 (M‐R) cell lines for 48 hours. Colomitide C (A, G,M), ZAD4547 (B, H, N), Brivanib (C, I, O), GSK690693 (D, J, P), MK‐2206 (E, K, Q) and Wortmannin (F, L, R) were used. The x axis represents the concentration of chemicals on a log10 scale and the y axis represents fractional viability |