
- Title
-
Enteric glia as a source of neural progenitors in adult zebrafish
- Authors
- McCallum, S., Obata, Y., Fourli, E., Boeing, S., Peddie, C.J., Xu, Q., Horswell, S., Kelsh, R., Collinson, L., Wilkinson, D., Pin, C., Pachnis, V., Heanue, T.A.
- Source
- Full text @ Elife
( |
( |
( |
( |
( |
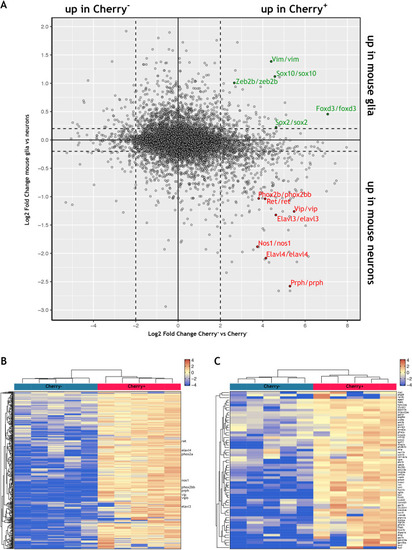
Using the mouse single cell transcriptomic data from |
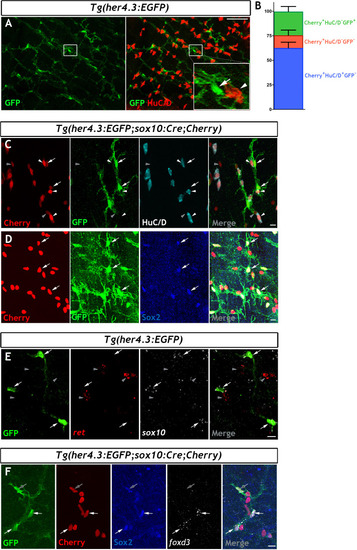
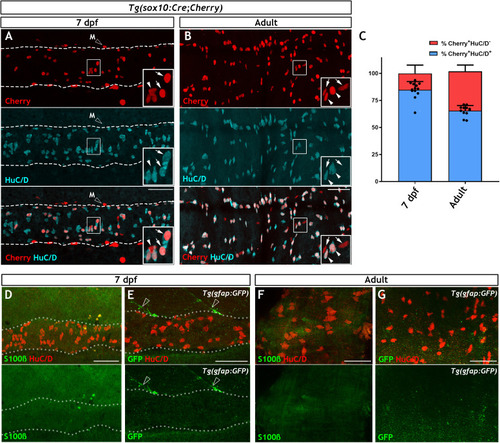
Immunohistochemistry of adult guts from of |
Immunohistochemistry of adult guts from of |
( |
( |
( |
( |
( |
( |
( |
Given the similarities between |
( |
( |