
- Title
-
Generation of foxn1/Casper Mutant Zebrafish for Allograft and Xenograft of Normal and Malignant Cells
- Authors
- Lv, P., Ma, D., Gao, S., Zhang, Y., Bae, Y.K., Liang, G., Gao, S., Choi, J.H., Kim, C.H., Wang, L., Liu, F.
- Source
- Full text @ Stem Cell Reports

ZFIN is incorporating published figure images and captions as part of an ongoing project. Figures from some publications have not yet been curated, or are not available for display because of copyright restrictions. |
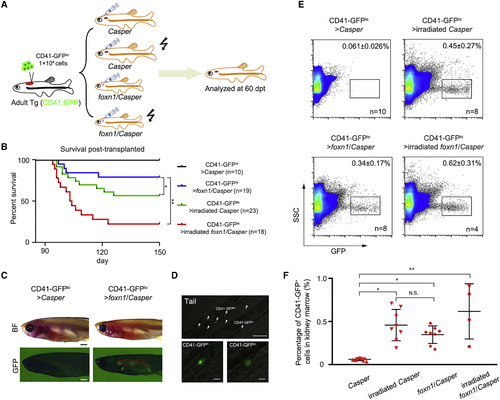
foxn1/Casper Mutant Engrafts HSCs without Irradiation (A) Schematic representation of the workflow of HSC transplantation. CD41-GFPlo cells were sorted from the KM of Tg (CD41:GFP), and 1 × 10⁴ CD41-GFPlo cells were injected into each recipient (Casper, 25-Gy-irradiated Casper, foxn1/Casper, and 15-Gy-irradiated foxn1/Casper). (B) The survival rate of each recipient at 60 days post transplantation (dpt). The irradiated foxn1/Casper showed a low survival rate after transplantation (data presented as days-percentage survival, t test; ∗p < 0.05, ∗∗p < 0.01; n (CD41-GFPlo > Casper) = 10, n (CD41-GFPlo > irradiated Casper) = 19, n (CD41-GFPlo > foxn1/Casper) = 23, and n (CD41-GFPlo > irradiated foxn1/Casper) = 18). (C) Imaging of representative recipients at 60 dpt. CD41-GFP+ cells could be visualized under a GFP field in the KM of nonirradiated foxn1/Casper mutant. The red dashed lines indicate the KM regions. n = 5; scale bar, 1 mm (kidney). (D) Confocal imaging of engrafted CD41-GFP+ cells at 60 dpt in tail region. White arrows indicate the CD41-GFPhi and CD41-GFPlo cells (top), and two magnified pictures show the CD41-GFPhi and CD41-GFPlo cells, respectively (bottom). Scale bar, 100 μm (top), 10 μm (bottom). (E) Representative flow-cytometric analysis of recipient KM at 60 dpt. The dots in the rectangles indicate engrafted CD41-GFP+ cells (mean ± SD, n [CD41-GFPlo > Casper] = 10, n [CD41-GFPlo > irradiated Casper] = 8, n [CD41-GFPlo > foxn1/Casper] = 8, and n [CD41-GFPlo > irradiated foxn1/Casper] = 4). (F) The statistical analysis of (E) (mean ± SD, one-way ANOVA, Tukey's; N.S., nonsignificant; ∗p < 0.05, ∗∗p < 0.01). See also Figure S2. |
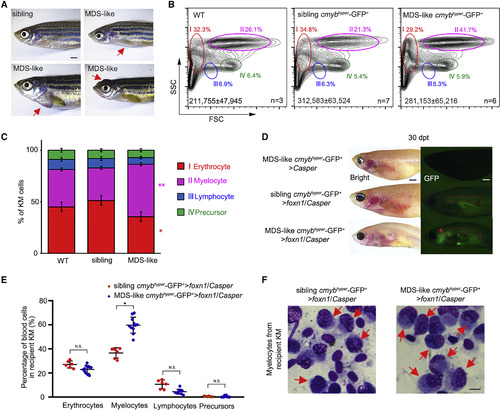
Allogeneic MDS-like Cell Transplantation with Tg (cmybhyper:GFP) (A) The pathologic external features of zebrafish Tg (cmybhyper:GFP). Some of the transgenic zebrafish display MDS-like phenotypes (exophthalmos, cachexia, and abdominal mass). The red arrows denote diseased areas. Scale bar, 1 mm. (B) Flow-cytometric analysis of 24-month-old WT (no transgenic background) and Tg (cmybhyper:GFP) KM. The representative percentages of myelocytes in WT, siblings, and MDS-like zebrafish are indicated. Total cell numbers in whole KM are indicated (mean ± SD; n [WT] = 3, n [siblings] = 7, n [MDS-like zebrafish] = 6). (C) Statistical analysis of the percentage of different blood lineages in (B) (mean ± SD, one-way ANOVA, Tukey's; ∗p < 0.05, ∗∗p < 0.01, n [WT] = 3, n [siblings] = 7, n [MDS-like zebrafish] = 6). (D) Direct observation of engrafted MDS-like cells. At 30 dpt, MDS-like cmybhyper-GFP+ cells could be visualized in foxn1/Casper recipient KM, not in the Casper. The red dashed lines indicate the KM regions. The red arrow indicates the engrafted MDS-like cmybhyper-GFP+ cells in the head. n (Casper) = 0/10, n (foxn1/Casper) = 9/12. Scale bar, 1 mm. (E) Statistical analysis of the percentage of different blood lineages in MDS-like and sibling cmybhyper-GFP+ cell-engrafted KMs. The cmybhyper-GFP+ cells in recipient KM were gated for analysis (mean ± SD, t test; N.S., non-significant; ∗p < 0.05; n > 3 in each group). (F) Wright-Giemsa staining of blood cells in recipient KM after MDS-like and sibling cmybhyper-GFP+ cell transplantation. The red arrows indicate the MDS-like myelocytes in recipients. Scale bar, 5 μm. |