- Title
-
CRISPR-Cas13d Induces Efficient mRNA Knockdown in Animal Embryos
- Authors
- Kushawah, G., Hernandez-Huertas, L., Abugattas-Nuñez Del Prado, J., Martinez-Morales, J.R., DeVore, M.L., Hassan, H., Moreno-Sanchez, I., Tomas-Gallardo, L., Diaz-Moscoso, A., Monges, D.E., Guelfo, J.R., Theune, W.C., Brannan, E.O., Wang, W., Corbin, T.J., Moran, A.M., Sánchez Alvarado, A., Málaga-Trillo, E., Takacs, C.M., Bazzini, A.A., Moreno-Mateos, M.A.
- Source
- Full text @ Dev. Cell
|
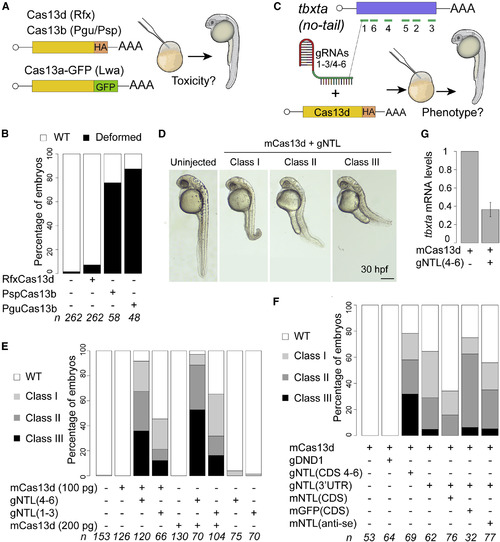
CRISPR-RfxCas13d System Targeting tbxta Recapitulates No-Tail Phenotype in Zebrafish Embryos (A) Schematic illustration of the experimental setup used to analyze CRISPR-Cas13 toxicity. 200 pg of mRNA from each Cas13 variant was injected into one-cell-stage zebrafish embryos. Cas13b and Cas13d are tagged with HA and Cas13a is fused to GFP. (B) Toxicity evaluation of embryos. Stacked barplots showing the percentage of deformed and wild-type (WT) zebrafish embryos (30 hpf) injected in conditions described in (A). Number of embryos evaluated (n) is shown for each condition. (C) Schematic of positions of six gRNAs (green lines) targeting tbxta CDS in zebrafish (top). Schematic of experimental setup to analyze CRISPR-RfxCas13d-mediated RNA knockdown in zebrafish (bottom). Two sets of gRNAs targeting tbxta CDS (1–3 or 4–6; 300 pg per embryo) were mixed with mRNA (100 or 200 pg per embryo) coding for RfxCas13d (mCas13d) and injected into one-cell-stage embryos. (D) Phenotypic severity in embryos injected with mCas13d and gRNAs targeting tbxta (gNTL) compared with uninjected WT evaluated at 30 hpf (scale bar, 0.5 mm). Class I: short tail (least extreme). Class II: absence of notochord and short tail (medium level). Class III: absence of notochord and extremely short tail (most extreme). (E) Different gNTL sets recapitulate no-tail phenotype. Stacked barplots showing percentage of observed phenotypes under various injection conditions. Number of embryos evaluated (n) is shown for each condition. (F) No-tail phenotype can be rescued. Stacked barplots showing percentage of observed phenotypes using gNTLs targeting 3′UTR (300 pg/embryo) and mCas13d (200 pg/embryo) co-injected with different mRNAs: GFP (mGFP CDS, 100 pg/embryo), tbxta ORF with 3′UTR from pSP64T plasmid (mNTL CDS, 100 pg/embryo), or tbxta antisense (mNTL anti-se, 100 pg/embryo) ORF. As an additional control, an unrelated gRNA set targeting a gene involved in germ cell formation (dnd1) was included (300 pg/embryo). Number of embryos evaluated (n) is shown for each condition. (G) qRT-PCR analysis showing levels of tbxta mRNA at 6 hpi in conditions indicated. Results are shown as the averages ± standard error of the mean from two independent experiments with 1 or 2 biological replicates per experiment (n = 20 embryos/biological replicate) for mCas13d alone and Cas13d plus gNTL, respectively. p = 0.0092 (t test). cdk2ap mRNA was used as normalization control. |
|
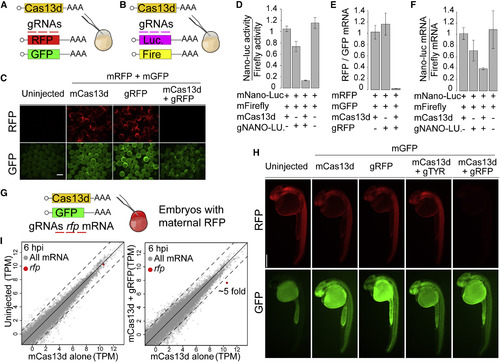
CRISPR-RfxCas13d Specifically Targets Reporter mRNAs in Zebrafish Embryos (A and B) Schematics of (A) rfp and gfp mRNAs or (B) nano-luciferase and firefly mRNAs (10 pg/embryo) co-injected with/without mCas13d (200 pg/embryo) and/or gRNAs (250–400 pg/embryo) targeting rfp or nano-luciferase mRNA, respectively. (C) Fluorescence images of representative embryos at 6 hpi with indicated mRNAs and gRNAs (scale bar, 0.5 mm). (D) Ratio of nano-luciferase (nano-luc) activity normalized to firefly luciferase activities under indicated conditions at 6 hpi. Results are shown as the averages ± standard error of the mean from at least 11 biological replicates from two independent experiments (n = 5 embryos/biological replicate). p < 0.021, mCas13d and gNANO-LUC compared with other conditions (Kruskal-Wallis test). (E) qRT-PCR analysis of ratio of RFP reporter mRNAs under indicated conditions at 6 hpi normalized with gfp mRNA. Results are shown as the averages ± standard error of the mean from two independent experiments with at least 2 biological replicates per experiment (n = 20 embryos/biological replicate). p < 0.0001, mCas13d and gRFP compared with other conditions (one-way ANOVA). (F) Nano-luciferase (nano-luc) mRNA level normalized to firefly mRNA level at 6 hpi at indicated conditions. Results are shown as the averages ± standard error of the mean from two independent experiments with 2 biological replicates per experiment (n = 20 embryos/biological replicate). p < 0.05, mCas13d and gNANO-LUC compared with mCas13d alone or mNano-Luc and mFirefly alone (one-way ANOVA). (G) Schematic of mRNAs (Cas13d and gfp) and gRNAs targeting rfp introduced into embryos derived from transgenic mother expressing rfp. (H) Fluorescence images of representative embryos at 26 hpi injected with indicated mRNAs and/or gRNAs (scale bar, 0.5 mm). (I) Scatterplot showing mRNA level (RNA-seq) of zebrafish embryos at 6 hpi. Left panel, mRNA level of uninjected embryos versus embryos injected with mCas13d alone. Right panel, mRNA level of embryos injected with mCas13d plus gRFP versus embryos injected with mCas13d alone. Rfp mRNA is indicated in red. Dashed lines indicate a 4-fold difference between RNA levels. |
|
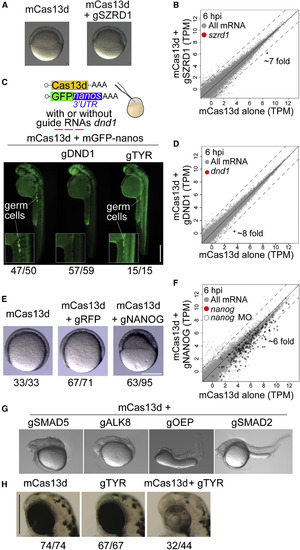
CRISPR-RfxCas13d Recapitulates Known Loss-of-Function Zebrafish Phenotypes (A) Representative pictures of zebrafish embryos (6 hpi) injected with mCas13d alone or mCas13d plus szrd1 gRNAs (gSZRD1) (scale bar, 10 μm). (B) Scatterplot showing mRNA level (RNA-seq) of zebrafish embryos injected with mCas13d (250 pg/embryo) alone versus mCas13d plus gSZRD1 (600 pg/embryo) after 6 hpi, szrd1 mRNA is indicated in red (>7-fold change). Dashed lines indicate a 4-fold difference between RNA levels. (C) Schematic of mCas13d (200–250 pg/embryo) and gfp mRNA containing the 3′UTR of nanos (40 pg/embryo) co-injected with/without gRNAs targeting dnd1 (500–600 pg/embryo) or tyr (500–600 pg/embryo). Germ cells are highlighted by germ-cell-specific fluorescence (due to nanos-3′UTR) at 30 hpf. The ratio of embryos displaying intact germ cells (mCas13d alone or mCas13d plus gTYR) or without germ cells (mCas13d plus gDND1) versus total number of analyzed embryos (at least from two independent experiments) are indicated (scale bar, 0.5 mm). (D) Scatterplot showing mRNA level (RNA-seq) of zebrafish embryos injected with mCas13d (250 pg/embryo) alone versus mCas13d plus dnd1 gRNAs (600 pg/embryo) after 6 hpi, dnd1 mRNA is indicated in red (~8-fold change). Dashed lines indicate a 4-fold difference between RNA levels. (E) Representative pictures of epiboly-stage zebrafish embryos displaying gastrulation and epiboly defects in embryos injected with mCas13d plus nanog gRNAs (gNANOG), but not in embryos injected with either mCas13d alone or mCas13d plus rfp gRNAs (gRFP). The ratios of embryos displaying normal development (mCas13d mRNA alone or mCas13d mRNA plus gRFP) or with epiboly and gastrulation defects (mCas13d mRNA plus gNANOG) versus total number of analyzed embryos are indicated. Embryos were injected with 250, 430, and 600 pg of mCas13d, gRFP, and gNANOG, respectively (scale bar, 0.1 mm). (F) Scatterplot showing mRNA level (RNA-seq) of zebrafish embryos injected with mCas13d plus gNANOG compared with embryos injected with mCas13d alone at 6 hpi. nanog mRNA is indicated in red. Black outline indicates genes that display reduced expression (>4-fold decrease) in nanog morpholino-treated (MO) embryos. Dashed lines indicate a 4-fold difference between RNA levels. (G) Representative pictures of zebrafish embryos injected with mCas13d plus the indicated gRNAs targeting smad5, alk8, oep, and smad2 mRNA showing the recapitulated phenotypes. (H) Pigmentation phenotypes (52 hpf) of head/eyes of embryos injected with mCas13d alone (300 pg/embryo, left), tyr gRNAs alone (600 pg/embryo, center), or both (right) (scale bars, 0.5 mm). The ratios of embryos displaying intact pigmentation (mCas13d or gTYR alone) or with the lack of pigmentation (mCas13d plus gTYR) versus total number of analyzed embryos are indicated. |
|
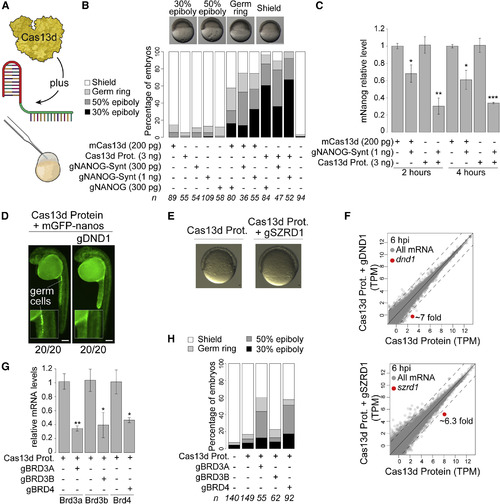
RfxCas13d Protein Enhances Maternal RNA Targeting (A) Schematic illustration of the experimental setup to use CRISPR-Cas13d purified protein. (B) Stacked barplots showing percentage of observed phenotypes in embryos injected with RfxCas13d mRNA (mCas13d) or protein (Cas13d Prot.), alone or together with in-vitro-transcribed (gNANOG) or chemically synthesized (gNANOG-Synt) gRNAs. The amount of gRNA, mRNA, or protein injected per embryo is indicated. Number of embryos evaluated (n) is shown for each condition. Representative pictures of epiboly-stage zebrafish embryos displaying gastrulation and epiboly defects in embryos injected with Cas13d protein plus gNANOG are shown in the top panel. 30% epiboly, 50% epiboly, germ ring, and shield stages correspond to 4.6, 5.3, 5.7, and 6 hpf in WT embryos growing in standard conditions, respectively (scale bar, 0.5 mm). (C) qRT-PCR analysis of nanog mRNA in embryos at 2 and 4 hpi injected with mCas13d or protein alone or together with gRNAs targeting nanog mRNA. Results are shown as the averages ± standard error of the mean from two independent experiments with at least 2 biological replicates per experiment (n = 10 embryos/biological replicate). Taf15 mRNA was used as normalization control. (∗p < 0.05, ∗∗p < 0.01, ∗∗∗p < 0.001 t test, comparing each knockdown condition versus its corresponding control) (D) Fluorescence pictures of zebrafish embryos (30 hpi) injected with Cas13d protein (3 ng) and GFP with nanos 3′UTR (40 pg) without or with gDND1 (400 pg). Insets show magnification of the region where the germ line forms. The ratio of embryos displaying intact germ cells (mCas13d alone) or without germ cells (mCas13d plus gDND1) versus total number of analyzed embryos (at least from two independent experiments) are indicated (scale bar, 0.5 mm). (E) Representative pictures of zebrafish embryos (7 hpi) injected with Cas13d protein alone (3 ng) or Cas13d protein plus gSZRD1s (400 pg) (scale bar, 10 μm). (F) Scatterplot showing mRNA level (RNA-seq) of zebrafish embryos injected with Cas13d protein plus dnd1 or szrd1 gRNAs compared with that of embryos injected with Cas13d protein alone at 6 hpi. Dnd1 and szrd1 mRNAs are indicated in red in their respective panels (>7-fold and >6.3-fold decrease, respectively). Dashed lines indicate a 4-fold difference between RNA levels. (G) qRT-PCR analysis showing levels of brd3a, brd3b, and brd4 mRNAs in embryos at 4 hpi injected with Cas13d protein alone (3 ng/embryo) or together with gRNAs (300 pg/embryo) targeting the different brds mRNAs. Results are shown as the averages ± standard error of the mean from two independent experiments with at least 2 biological replicates per experiment (n = 10 embryos/biological replicate). Taf15 mRNA was used as normalization control (∗p < 0.05, ∗∗p < 0.01, t test comparing each knockdown condition versus its corresponding control). (H) Stacked barplots showing percentage of observed phenotypes using gRNAs targeting brd3a, brd3b, and brd4 mRNAs co-injected with Cas13d protein at the same concentrations. Number of embryos evaluated (n) is shown for each condition. The phenotype selection criteria were the same as in (B). |
|
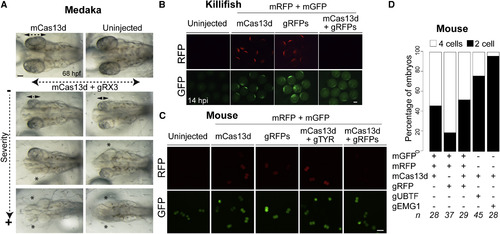
CRISPR-RfxCas13d as RNA Targeting Tool in Different Animal Models (A) Representative pictures of medaka embryos at 68 hpf showing arrested eye development in embryos injected with mCas13d (450 pg) with gRNAs (1 ng) targeting rx3 mRNA (gRX3) compared with the embryos injected with mCas13d alone or uninjected embryos. Double arrows and asterisk indicate eye length and absence of eye, respectively (scale bar, 0.1 mm). (B) Fluorescence microscopy images of killifish embryos showing RFP and GFP intensity of uninjected embryos or after 14 hpi injected with rfp and gfp mRNAs, with or without mCas13d (250–350 pg/embryo) and/or gRNAs (300–400 pg/embryo) targeting rfp mRNA (scale bar, 0.1 mm). (C) Fluorescence microscopy images of mouse embryos 24 hpi (2 cells stage) with rfp and gfp mRNAs with or without mCas13d and/or gRNAs targeting rfp or unrelated (zebrafish tyr) mRNA (scale bar, 100 μm). (D) Stacked plots showing the percentage of mouse embryos at 2 or 4 cells stage 48 hpi with the indicated mRNA and/or gRNAs. The number of embryos (n) is indicated from at least two independent experiments. |
Reprinted from Developmental Cell, 54(6), Kushawah, G., Hernandez-Huertas, L., Abugattas-Nuñez Del Prado, J., Martinez-Morales, J.R., DeVore, M.L., Hassan, H., Moreno-Sanchez, I., Tomas-Gallardo, L., Diaz-Moscoso, A., Monges, D.E., Guelfo, J.R., Theune, W.C., Brannan, E.O., Wang, W., Corbin, T.J., Moran, A.M., Sánchez Alvarado, A., Málaga-Trillo, E., Takacs, C.M., Bazzini, A.A., Moreno-Mateos, M.A., CRISPR-Cas13d Induces Efficient mRNA Knockdown in Animal Embryos, 805-817.e7, Copyright (2020) with permission from Elsevier. Full text @ Dev. Cell

