- Title
-
Long-term in vivo imaging reveals tumor-specific dissemination and captures host tumor interaction in zebrafish xenografts
- Authors
- Asokan, N., Daetwyler, S., Bernas, S.N., Schmied, C., Vogler, S., Lambert, K., Wobus, M., Wermke, M., Kempermann, G., Huisken, J., Brand, M., Bornhäuser, M.
- Source
- Full text @ Sci. Rep.
|
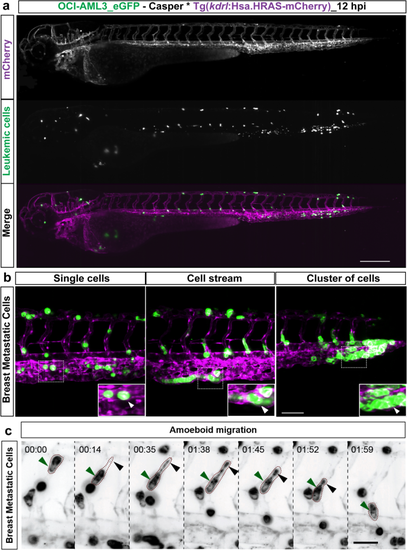
Dissemination and migration modes of tumor cells. (a) Snapshot from time-lapse movie of eZXM expressing the vascular marker Tg(kdrl:Hsa.HRAS-mCherry) in casper background (magenta label) injected with eGFP labeled leukemic cells (OCI-AML3_eGFP) (green label). The cells disseminated throughout the embryo. Scale bar: 500 µm. (b) High-magnification SPIM revealed diverse migratory modes of breast tumor cells. Representative images of tumor cells migrating either as single cells (left), loosely attached cell streams (center), or cluster of cells (right) indicated by white arrowheads. Insets showed the higher magnification of dotted boxes; Vasculature in magenta, breast tumor cells in green; scale bar 100 µm. (c) A breast tumor cell (MDA-MB-231, green label, green arrowheads) migrating through an intersegmental vessel (magenta label) in an amoeboid fashion (as indicated by dashed brown border). The cell formed a large protrusion, with a filopodia-like arm at the trailing end (black arrowheads). Time shown as h:min, scale bar 50 μm. |
|
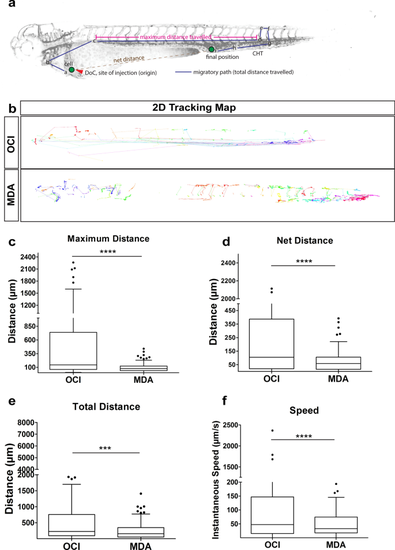
Tumor cell tracking revealed dynamics of xenografted cells. (a) Schematic of the quantified dissemination characteristics of a xenografted cell (green). DoC Duct of Cuvier, CHT caudal hematopoietic tissue. (b) 2D tracking map of the migratory path taken by every cell in vivo using semi-automated tracking analysis of the SPIM time-lapse movies. The tracking map revealed circulatory paths of leukemic cells (OCI, top), short migratory paths of breast tumor cells (MDA, bottom). Each color represented an individual cell. (c–f) Representative plot of R-analysis of the cell tracking revealed that (c) the maximum distance between any two time points was higher in leukemic cells (OCI) compared to either breast tumor cells (MDA). (d) The net distance was significantly higher for leukemic cells (OCI) compared to breast tumor cells (MDA (e) Leukemic cells (OCI) covered a significantly greater total distance compared to breast tumor cells (MDA). (f) Intravascular speed measurements in both cell types: breast tumor cells (MDA), and leukemic cells (OCI) revealed that OCI showed fastest migration. (c–f) Plots represent means ± sem.[N = 3 embryos; for each embryo ~ 150 to 200 cells were analyzed] Statistical analyses: (c–f) Kruskal–Wallis one-way analysis of variance were performed followed by post hoc Dunn’s method for multiple comparisons. Multiple comparisons: (c–f) OCI vs. MDA. |
|
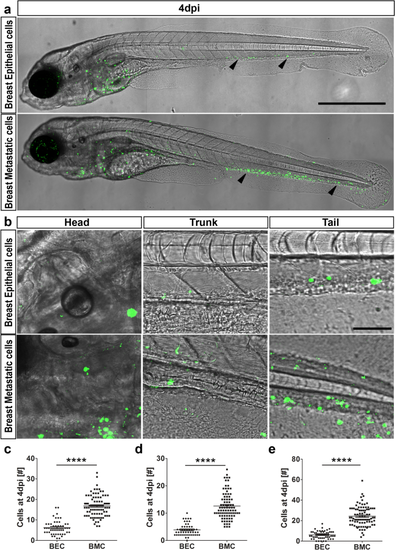
Dissemination of epithelial versus metastatic cells. (a) At 4 dpi, breast epithelial cell (BEC) numbers were drastically reduced compared to breast metastatic cells (BMC), as indicated by black arrowheads. Both breast epithelial and breast metastatic cells were depicted in green on a transmission image of zebrafish. Scale bar 500 µm. (b) Representative images of head, trunk, and tail regions of both BEC and BMC with high magnifications. Scale bar 50 µm. (c–e) Quantifications of the cells at 4 dpi in all the regions. Head (c), trunk (d), and tail (e) showed that breast metastatic cells survived better in the eZXM [N = 80 embryos each]. In all the regions observed, the cell numbers were significantly higher for breast metastatic cells. (c–e) Plots represent means ± sem. Statistical analyses: two-tailed Mann–Whitney’s U-test. |
|
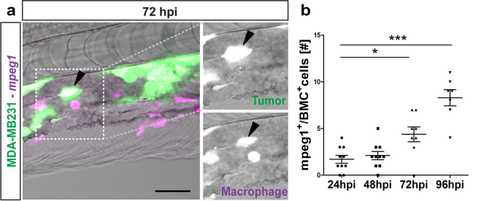
Macrophages react to tumor cells. (a) Representative image of GFP-labeled breast metastatic cells (BMC) (MDA-MB231) (in green) xenografted in eZXM expressing mCherry-labeled macrophages (in magenta). Co-localization of tumor cells with macrophages was observed (black arrowhead). Higher magnification of boxed region with MDA-MB231 cell (green—top) and macrophage (magenta—bottom). Scale bar 100 µm. (b) Quantification of the co-localization of tumor cells (BMC+) with macrophages (mpeg1+) over time. At 72 hpi, a significant increase in co-localization was observed. Plot represented means ± sem [N = 10 embryos were quantified for each time points: 24, 48 hpi and 96 hpi]. Statistical analyses: one-way ANOVA followed by Dunnett’s test for multiple comparisons. Multiple comparisons: 24 hpi vs. 48 hpi (P = 0.9225); 24 hpi vs. 72 hpi (P = 0.0103); 24 hpi vs. 96 hpi (P < 0.0001). |
|
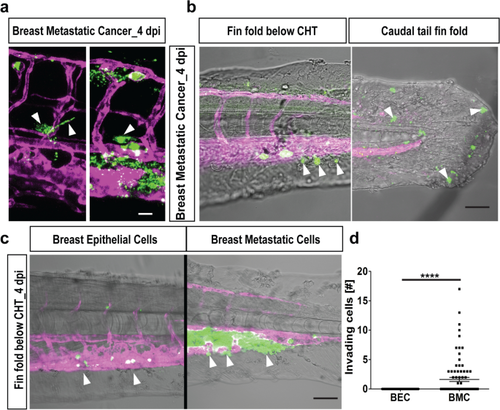
Extravasation and invasion of tumor cells. (a) Representative images of breast cancer cells (in green) initiating extravasation through the vasculature (in magenta) by forming protrusions (left, white arrowheads). These protruding cells later pushed the entire cellular content into the surrounding tissue (right, white arrowhead). Scale bar 20 µm. (b) Breast metastatic cells (in green) invaded the avascular tail region (vasculature in magenta). Two representative images of invading tumor cells (white arrowheads) in the fin-fold below the CHT region (left) and caudal tail fin-fold (right). Scale bars: 150 µm. (c) Representative images of invasion of cells out of the vasculature (in magenta) below CHT. Breast epithelial cells (in green) did not invade below CHT (white arrowheads, left panel) while few of the breast metastatic cells (in green) showed invasion below CHT (white arrowheads, right panel). Scale bar: 150 µm. (d) Quantification at 4 dpi revealed significant tail invasion of the breast metastatic cells (BMC) over breast epithelial cells (BEC) [N = 80 embryos each]. Plots represent means ± sem. Statistical analyses: two-tailed Mann–Whitney’s U-test. |
|
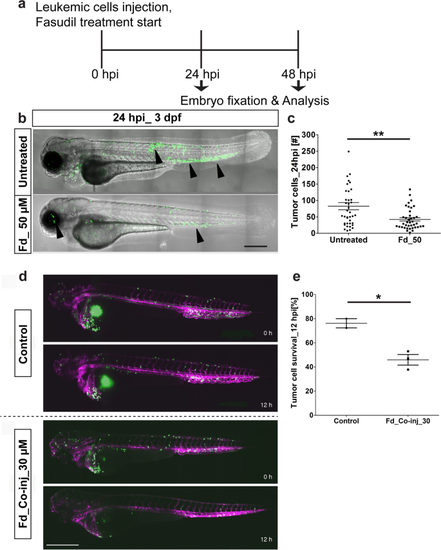
Effect of Fasudil on leukemic cells in the eZXM. Validation of the eZXM with the ROCK1 inhibitor Fasudil. (a) Schematic diagram depicting the experimental design: Leukemic cells (in green) were injected at 48 hpf, followed by the start of the Fasudil treatment to half cohort of the injected embryos and the other half were maintained in the normal E3 medium (control: untreated). At 24 hpi, few embryos were fixed and analyzed for tumor survival and at 48 hpi, remaining embryos were fixed and analyzed; (b) 50 µM Fasudil treatment (bottom) of the eZXM revealed a significant reduction (black arrowheads) in eGFP labeled leukemic cells (in green) at 24 hpi compared to untreated controls (top). (c) Quantification of tumor cells at 24 hpi showed a decrease in tumor cell number in 50 µM Fasudil-treated embryos [N = 40 embryos]. (d) Frames from the time-lapse movies showed dissemination of eGFP-tagged leukemic cells (in green) inside the eZXM expressing the vasculature marker Tg(kdrl:Hsa.HRAS-mCherry) (magenta) at the beginning of the experiment (0 h) and after 12 h (12 h) in treated and untreated fish. (e) Quantified survival rate of the leukemic cells as observed from the in vivo time-lapse movies (right). Scale bar 500 µm. (c, e) Plots represent means ± sem. Statistical analyses: (c) two-tailed Mann–Whitney’s U-test, (e) Welch Two Sample t-test. |
|
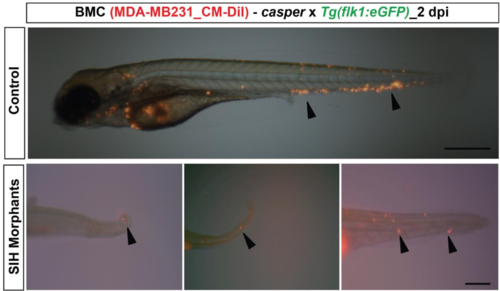
Active migration of the tumor cells. Breast metastatic tumor cells (BMC) labeled with CM-DiI were injected into silent heart morpholino injected eZXM. Silent heart morpholino stopped the heartbeat. Representative image of control morpholino eZXM injected with breast tumor cells (black arrowheads) with dissemination throughout the embryo (top). In the no-flow environment, breast tumor cells (black arrowheads) migrated actively from the site of administration towards the tail region (bottom). |
|
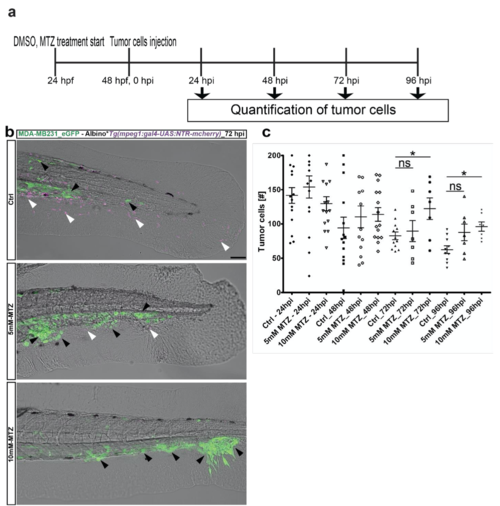
Ablation of macrophages revealed improved tumor cell survival. (a) Scheme depicting the experimental design: mCherry positive embryos were treated with either DMSO (for control) or MTZ (concentration: 5mM and 10mM) from 24 hpf. Every day, the embryo medium was changed with fresh DMSO and MTZ solution. 10 mM MTZ treatment resulted in 90% ablation of macrophages. Tumor cells were injected at 2 dpf and followed until 96 hpi. Every day embryos were analysed for tumor cell survival using confocal microscopy. (b) Representative image of GFP-labeled breast metastatic cells (BMC) (MDA-MB231) xenografted in eZXM expressing mCherry-labeled (magenta) macrophages at 72 hpi. In the top, control panel (ctrl), macrophages (magenta - white arrowhead) was observed in great numbers along with tumor cells (green – black arrowhead). 5mM-MTZ treatment showed hardly 2-3 macrophages (magenta - white arrowhead) were found and tumor cell number were comparatively higher to top control panel. 10mM-MTZ treatment in the bottom panel showed improved tumor cell numbers and almost no macrophages. Scale bar 100 μm. (b) Quantification of the tumor cells (BMC+) over time. At 72 hpi, a significant increase in the tumor cell survival was observed in the 10mM MTZ treated group compared to the control DMSO group. Plot represented means ± sem. Statistical analyses: one-way ANOVA followed by Dunnett’s test for multiple comparisons. Multiple comparisons: Ctrl_72hpi vs. 5mM MTZ_72hpi (P = 0.8699); Ctrl_72hpi vs. 10mM MTZ_72hpi (P = 0.0335); Ctrl_96hpi vs. 5mM MTZ_96hpi (P = 0.0667); Ctrl_72hpi vs. 10mM MTZ_72hpi (P = 0.0136). |
|
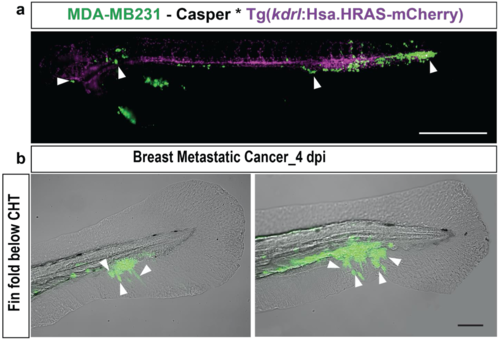
Dissemination and tail invasion of metastatic breast tumor cells with stable GFP expression. (a) Representative image of eZXM expressing the vascular marker Tg(kdrl:Hsa.HRAS-mCherry) in the casper background injected with eGFP labeled breast tumor cells (MDA-MB231_eGFP). The cells disseminated throughout the embryo as indicated by the white arrowhead. Vasculature in magenta, breast tumor cells in green; scale bar: 500 μm. (b) Representative images of breast tumor cells initiating extravasation by forming protrusions (left, white arrowheads). Breast metastatic cells invaded the avascular tail region. Representative images of invading tumor cells (white arrowheads) in the fin-fold below the CHT region. Scale bars:100 μm. |
|
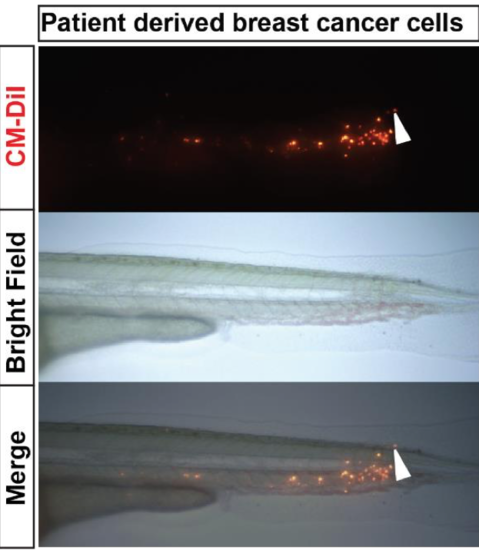
Tail invasion of primary breast tumor cells. Primary tumor cells (top) were labeled with CM-DiI and injected in the eZXM. Imaging of the tail part of at 1 dpi (bright field image, middle), revealed invasion of the tail fin fold region by a single cell (white arrowhead). |
|
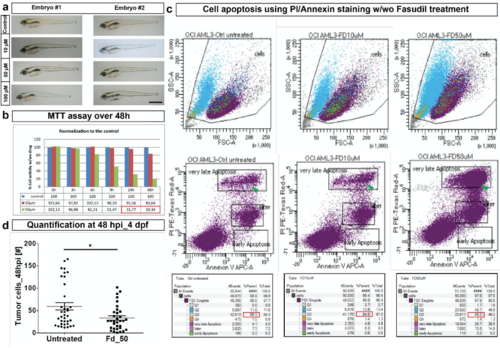
In vitro and in vivo effect of Fasudil. (a) Representative image of two embryo with different concentrations of Fasudil treatment to assess the phenotypic effect. Until 3 days post treatment (dpt), embryos did not show any phenotypic abnormality due to Fasudil treatments in comparison to control untreated embryos. Scale bar: 50 μm. dpt - days post treatment. (b) In in vitro culture, leukemic cells treated with Fasudil for 48 h showed a reduction of 80 % in their metabolic activity at 50 μM concentration using MTT assay (indicated by the values in red box). (Error bars are not indicated as experiment was performed only twice, a representative plot is shown here). (c) PI/Annexin staining on leukemic cells treated with Fasudil in in vitro for 24 h showed cells were apoptotic in comparison to control (left) as indicated by the green arrowhead in the second row of panel. Around 50 % of cells were only remaining after 50 μM Fasudil treatment as indicated by the red box in third row (right most bottom panel). (d) Quantification of tumor cells at 48 hpi in vivo in the zebrafish embryo showed a decrease in tumor cell number in 50 μM Fasudil- treated embryos [N=36 embryos]. Plots represent means ± sem. Statistical analyses: two-tailed Mann-Whitney’s U-test |

