FIGURE SUMMARY
Title

Dopaminergic neurons regenerate following chemogenetic ablation in the olfactory bulb of adult Zebrafish (Danio rerio)

Authors
Godoy, R., Hua, K., Kalyn, M., Cusson, V.M., Anisman, H., Ekker, M.
Source
Full text @ Sci. Rep.

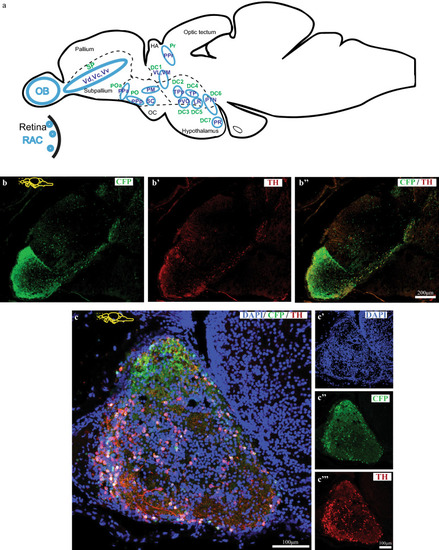
Expression of Tg(dat:CFP-NTR) in the adult zebrafish brain. (a) Schematic representation of DA clusters expressing CFP-NTR. These include the amacrine cells of the retina (RAC), cells of the olfactory bulb (OB), of the ventral telencephalon (Vd, Vc and Vv), of the preoptic area (POa, PO), periventricular pretectal nucleus (PPr) and DA-producing cells of the diencephalon (DC). (b) Sagittal section of the telencephalon showing CFP-expressing cells (green) and co-expression with TH (red). (c) Sagittal section of adult zebrafish olfactory bulb showing cell nuclei (DAPI) (c′), CFP (c″) and TH (c‴). (d) Transverse section of a medial olfactory bulb section showing expression of DAPI (d), CFP (green) (d′) or TH (red) (d″) and its colocalization (d‴); followed by its magnified image (ee‴).

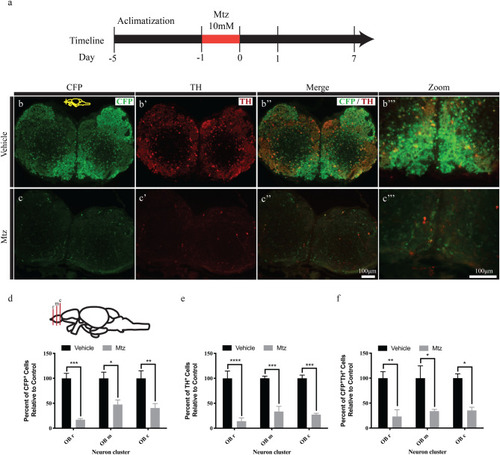
Ablation of DA neurons following Mtz treatment. (a) Timeline of experiment. (bb‴) Representative immunofluorescence of CFP positive (Green) and TH positive (Red) cells in the OB of vehicle control fish. (bb‴). Ablation of CFP (Green) and TH (Red) positive cells in the OB of Mtz-treated fish (cc‴). (df) Quantification of the number of CFP+ (d), TH+ (e), and CFP + /TH + cells expressing CFP and TH (f). Quantification was conducted in 3 areas of OB, a rostral (OBr), a medial (OBm) and a more caudal (OBc) area. *(p ≤  0.05), **(p ≤  0.01), ***(p ≤  0.001) and ****(p ≤  0.0001).

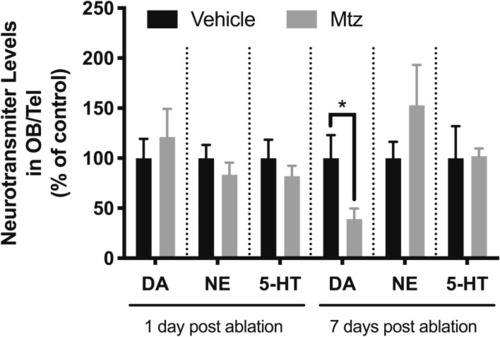
Decrease in neurotransmitter levels following ablation of dopaminergic neurons. Levels of dopamine (DA), serotonin (5-HT) and norepinephrine (NE) were measured in dissected OB/telencephalon tissue, 1 or 7 days post-Mtz treatment. *(p ≤  0.05).

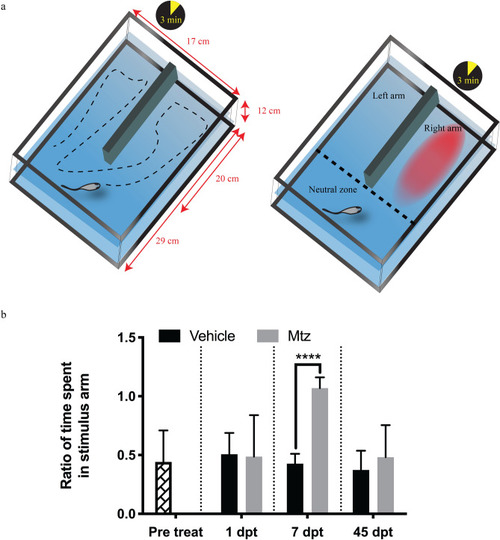
Decreased olfactory function following neuronal ablation. (a) Schematic representation of the tank designed to address OB phenotype. The tank contained a mid-tank wall separating space into 3 areas: left arm, right arm and neutral zone. Animals were allowed to swim freely for 3 min prior to the addition of repulsive stimulus cadaverine. Animal response to the stimulus was recorded for 3 additional minutes. (b) Animals tend to spend equal time swimming across different zones of tank prior to stimuli. Upon stimulus, control fish decrease total time spent in the stimulus arm, whereas this ability is impaired upon Mtz treatment at 7 days post ablation but recovered by day 45. ****(p ≤  0.0001). (Sample size of n = 6 animals for each treatment and time poit except for 1 dpt where n = 3, statistical power was calculated using a multiple t test corrected for multiple comparison using Holm–Sidak post hoc).

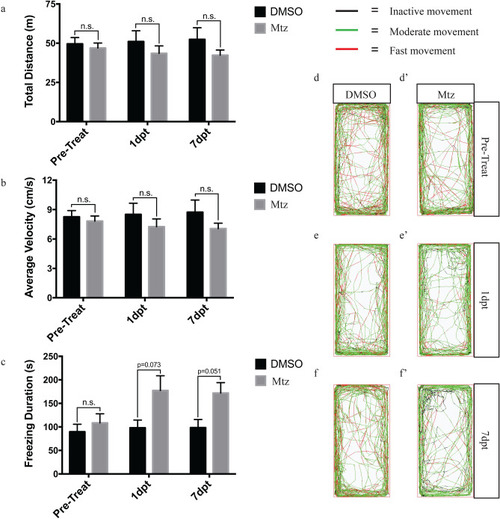
Relative swimming activity of Mtz and DMSO treated adult zebrafish. All zebrafish were transferred to individual tanks to acclimate for 30 min prior to behavioural analyses. (ac) Effects of Mtz and DMSO on total distance travelled, average velocity, and freezing bout duration. (d/d′–f/f′) Overhead path images of adult zebrafish assessed at 3 time points; pre-treatment, 1 dpt, and 7 dpt. Inactive movements (0–4 cm/s), moderate movement (4–8 cm/s) and fast movement (> 8 cm/s). The graphs were made with GraphPad Prism 7.0 and the path images were generated with the ZebraLab software and ZebraCube tracking system (ViewPoint Life Science, Lyon, France). Sample sizes of n = 10; bars represent the Mean ± the SEM; statistical power calculated using a two-way ANOVA followed by Tukey’s multiple comparison test.

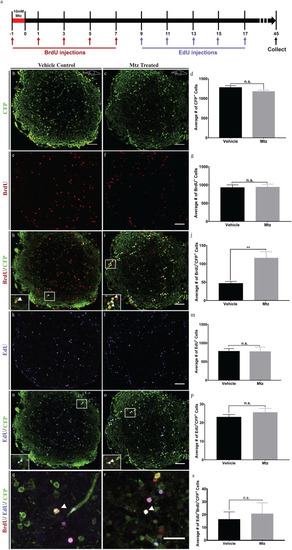
Formation of new CFP positive cells following neuronal ablation only occur before 9 days post ablation. (a) Timeline of experiment. (b, c) Representative images of a coronal OB section from Vehicle control (b) and Mtz treated (c) fish with cells expressing CFP. (d) Quantification of the number of CFP positive cells showing no significant difference between Mtz treated and control fish (n = 6). (e, f) Representative images of a coronal OB section from Vehicle control (e) and Mtz treated (f) fish with cells positive for BrdU. (g) Quantification of the number of BrdU positive cells relative to control. There was no significant difference between Mtz treated fish relative to control (n = 6). (h, i) Representative images of a coronal OB section from Vehicle control (h) and Mtz treated (i) fish with cells expressing. (j) Quantification of the number of cells positive for both BrdU and CFP relative to control. There was a 2.5-fold increase in the number of double labelled cells in Mtz-treated fish relative to control (n = 6). (k, l) Representative images of a coronal OB section from Vehicle control (k) and Mtz treated (l) fish with cells positive for EdU. (m) Quantification of the number of EdU positive cells relative to control. There was no significant difference between Mtz treated and control fish (n = 6). (n, o) Representative images of a coronal OB section from Vehicle control (n) and Mtz treated (o) fish with cells positive for both EdU and CFP. (p) Quantification of the number of EdU and CFP positive cells relative to control. There was no significant difference between Mtz treated and control fish (n = 6). (q, r) Representative images of a coronal OB section from Vehicle control (q) and Mtz treated (r) fish positive for BrdU, EdU, and CFP. (s) Quantification of the number of triple-labelled cells relative to control. There was no significant difference between Mtz treated fish relative to control. **P < 0.01, n.s. = not significant, N = 6. Scale bar: 50 μm.

Acknowledgments
This image is the copyrighted work of the attributed author or publisher, and ZFIN has permission only to display this image to its users. Additional permissions should be obtained from the applicable author or publisher of the image. Full text @ Sci. Rep.