FIGURE SUMMARY
Title

Conserved and Divergent Features of Adult Neurogenesis in Zebrafish

Authors
Labusch, M., Mancini, L., Morizet, D., Bally-Cuif, L.
Source
Full text @ Front Cell Dev Biol

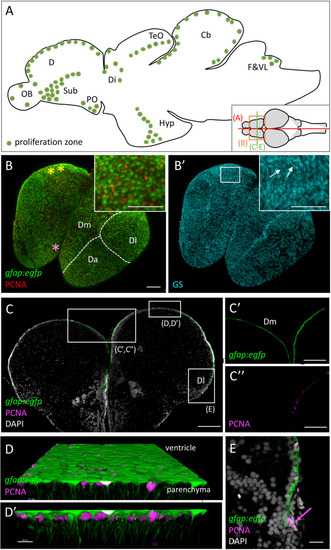
Progenitor cells in the zebrafish adult brain at 3 months-post-fertilization (mpf). (A) Scheme of a mid-sagittal section (anterior left) showing the localization of proliferation zones (colored dots) (Adolf et al., 2006; Grandel et al., 2006). (B,B’) Dorsal view of a whole-mount telencephalon from a gfap:egfp transgenic animal, processed in triple immunohistochemistry for GFP, PCNA (B), and GS (B’). Anterior is bottom left. Note the continuous layer of progenitor cells visible from the dorsal surface. Pallial territories are indicated by the dotted lines (see Dray et al., 2015). Yellow stars indicate the location of the territory homologous to the hippocampus (Ganz et al., 2015, and see Rodríguez et al., 2002 in goldfish), and the pink star the territory homologous to the amygdala (von Trotha et al., 2014). Anti-GS immunohistochemistry (B’) permits to see basal RG processes (arrows). (C–E) Cross-section of a telencephalon from a gfap:egfp transgenic animal, processed in double immunohistochemistry for GFP and PCNA and counter-stained with DAPI (C) and high magnifications of the domains boxed (C’,C”,E). In addition, a high magnification view of the ventricular zone of Dm is shown (D,D’) in 3D (Imaris software) to appreciate radial glial cell morphology. (E) Focus on NE progenitors at the pallial edge (arrow). Scale bars: (B,B’,C) 100 mm; (C’,C”) 30 mm; (D,D’) 20 mm; (E) 50 mm. Cb, cerebellum; D, dorsal part of the telencephalon (pallium) (Da: anterior part of D, Dm: medial part of D; Dl, lateral part of D); Di, diencephalon; F&VL, facial and vagal lobes; Hyp, hypothalamus; OB, olfactory bulb; PO, preoptic area; TeO, tectum opticum.

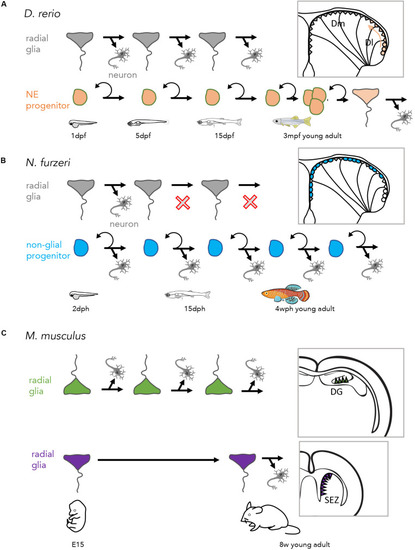
Lineages at the origin of adult neurogenic progenitors in the vertebrate pallium. (A) Lineages in zebrafish, generating adult RG from embryonic RG (top) and NE progenitors (bottom). (B) Lineages in the killifish, where neurogenesis in adults is ensured by a long-lasting non-glial embryonic lineage (blue) dph: days post-hatching, wph: weeks post-hatching. (C) Lineages in mouse, where distinct modes of NSC production are described in the DG (top) and SEZ (bottom) (Dirian et al., 2014; Furutachi et al., 2015; Song et al., 2018; Berg et al., 2019; Coolen et al., 2020).

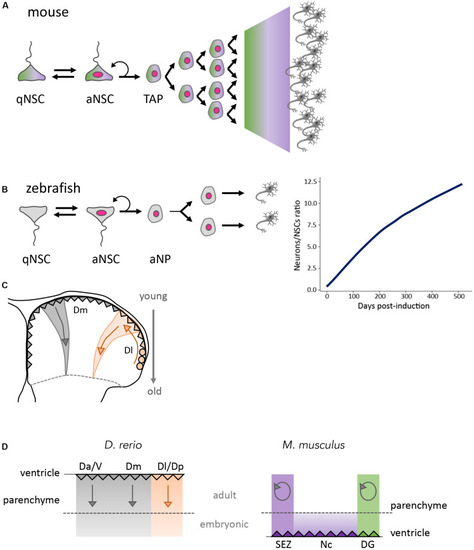
Global outputs of adult neurogenesis in zebrafish and mouse. (A) Scheme of a typical neurogenesis lineage in adult mouse. Upon quiescence exit, NSCs generate neurons via TAPs. TAPs have variable amplification capacity, high in the SEZ, lower in the DG. Green and purple shades are meant to represent shared cells and attributes between the SEZ and DG (color code in Figure 2C, with proliferating cells indicated with a pink nucleus). (B) Scheme of a typical neurogenic lineage in the adult zebrafish pallium (left) and neuronal output (right). Neurons are generated via an intermediate progenitor (NP: neural progenitor) of limited amplification potential. Because adult-generated neurons persist, however, the number of neurons generated per NSC increases over time in genetically traced lineages from individual NSCs. (C) Spatio-temporal distribution of the neurogenesis output in the zebrafish pallium, from embryonic stages until adult life. Radial glia (triangles) generate neurons that stack in age-related order within the telencephalic parenchyma. Old neurons, at the pallial-subpallial boundary, were generated in the embryo and early larva. In the lateral pallium (orange), the same process operates but radial glia are generated during juvenile and adult stages from NE progenitors (circles). Arrows indicate the spatial organization of neurogenesis over time. (D) Compared output of neurogenesis in the pallium of zebrafish and mouse from embryo to adult, represented on schematic cross-sections where the dotted line separates neurons generated at embryonic versus post-embryonic stages. Neurogenesis is continuous and additive (straight arrows) in zebrafish in all pallial subdivisions (left panel). Neurogenesis stops at birth in the mouse neocortex, spatially isolating the two persisting neurogenic niches SEZ and SGZ. Neurogenesis in these niches is mostly used for neuron replacement (circular arrows) (right panel). Color code as in Figure 1 (Seri et al., 2004; Encinas et al., 2011; Rothenaigner et al., 2011; Lugert et al., 2012; Ponti et al., 2013; Furlan et al., 2017; Than-Trong et al., 2020). D, dorsal part of the telencephalon (pallium); Da, anterior part of D; Dm, medial part of D; Dl, lateral part of D; aNSC, activated neural stem cell; qNSC, quiescent neural stem cell; NP, neural progenitor; TAP, transit amplifying progenitor; V, ventral telencephalon (sub-pallium).

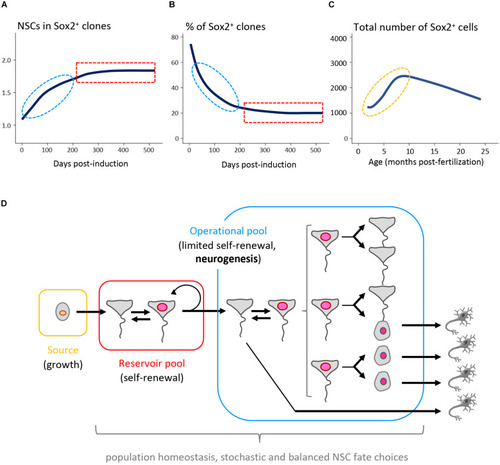
Long-term NSC and neurogenesis dynamic in the adult zebrafish pallium. (A,B) Genetic clonal analysis driven by the her4:ERT2CreERT2 transgene with chase time over 500 days. The number of NSCs per clone containing at least one Sox2+ cell (A) and the proportion of clones containing at least one Sox2+ cell (B) display a bi-phasic dynamics at long term. At early time points after induction, neutral drift is observed -red-. At later time points, a behavior characteristic of single cell-based self-renewal appears -blue-. These two dynamics reflect the behavior of two embedded populations (operational and reservoir, respectively). (C) Total number of Sox2+ cells in the adult Dm between 3 and 25 months post-fertilization (mpf). The Sox2+ population increases in size in the young adult (3–8 mpf), reflecting the NSC-generating activity of a “source” population (orange). (D) Schematic of the proliferative hierarchy of NSC sub-populations sustaining overall NSC maintenance in Dm. Color code as in (A–C) (Than-Trong et al., 2020).

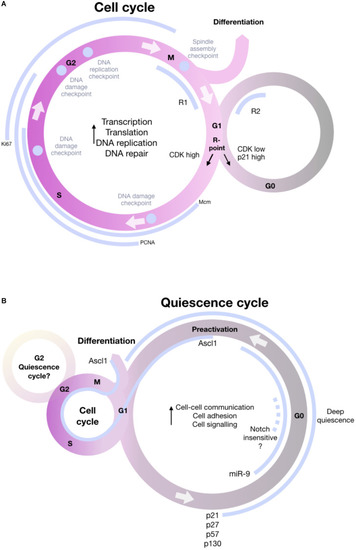
Schematic of the cell cycle including the most important information about the decision to enter quiescence, remain in cycle or differentiate. (A) General cell cycle knowledge, illustrating phases G1, S, G2, and M and the most important checkpoints (purple). During the cell cycle, proteins involved in transcription, translation, DNA replication and DNA repair are upregulated. The schematic includes proliferation markers MCM, PCNA, and Ki67 (gray) that are expressed in different phases of the cell cycle and commonly used to define proliferating NSCs. During the cell cycle, cells can enter into the quiescence state in G1, the decisions for entry happening at a R-point in G1. After passing the R-point, cells are committed to fulfill another cell cycle. Another important check-point is the bifurcation point right after mitosis, a window in which cells are sensitive to mitogen signals that influence CDK2 (R1 and R2 window on the schematic). Cells with a normal level of CDK2 will keep cycling, whereas cells with low levels of CDK2 will enter a transient quiescence and will face a second restriction window at the end of G1, controlled by the CDK inhibitor p21. Only cells that built up enough CDK will be able to bypass quiescence and eventually re-enter quiescence. (B) NSC-specific quiescence cycle. Quiescence can be entered in G1, or G2 (this remains to be shown for vertebrates). During quiescence, genes involved in cell-cell communication, cell adhesion and cell signaling are upregulated, stressing that quiescence is an actively maintained state. Some data (e.g., the dynamics of miR-9 expression) suggest that quiescence can be seen as a cycle, but alternative models exist. Quiescent cells express p21, p27, p57, and p130. Quiescence is heterogeneous, and deeper and shallower sub-states exist. miR-9 is nuclear in deeply quiescent cells. Some NSCs that are insensitive to Notch blockade can also be interpreted as deeply quiescent. A “pro-activated” state precedes activation proper. In this state, NSCs express ascl1, which will also be maintained during activation and differentiation (Pardee, 1974; Alunni et al., 2013; Spencer et al., 2013; Andersen et al., 2014; Katz et al., 2016).

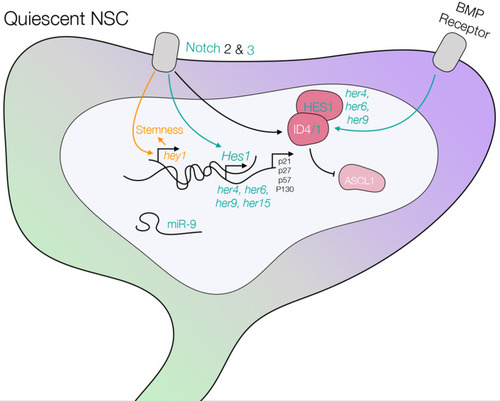
Schematic of a quiescent NSC including the pathways controlling quiescence, which are summarized in this review. The scheme highlights knowledge generated in mouse, and confirmed pathways in zebrafish are illustrated in green. Knowledge generated in zebrafish and later extended to mouse is shown in green as well. Knowledge generated in zebrafish and still to be confirmed in mouse is depicted in yellow. Differences (Notch2 is not expressed in qNSCs in zebrafish), or data that need consolidation in zebrafish (Ascl1 expression and its regulation by ID and Hes1, BMP receptor), are shown in black. See text and Table 3 for references.

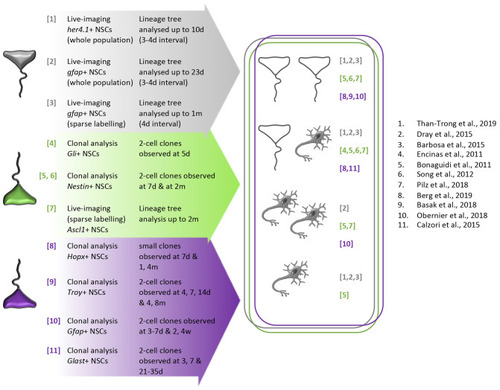
Schematic summary of division modes directly observed in adult mouse telencephalic neurogenic niches and in the zebrafish adult pallium in vivo. To evidence with certainty the existence of each division mode, we listed on the left part of the figure the clonal lineage tracing and live-imaging analyses only. For all the clonal analysis, we also only focused on 2–3-cell clones data at various time of induction/chase. Arrow depict the path leading individual NSC toward a cell fate decision (symmetrical self-renewing division, asymmetrical self-renewing division, symmetrical differentiating division or direct differentiation, illustrated on the right part of the figure). In the zebrafish pallium (gray NSCs), the mouse SEZ (purple NSCs), and the mouse SGZ (green NSCs), the three modes of division were evidenced. Direct neuronal differentiation was observed in the zebrafish adult pallium and mouse SEZ. In the SEZ, Gfap+ and Troy+ NSCs are able to symmetrically self-renew, symmetrically differentiate and asymmetrically divide whereas Glast+ NSCs were only described to asymmetrically divide. In the SGZ, Nestin+ and Ascl1+ NSCs can symmetrically self-renew, symmetrically differentiate and asymmetrically divide although Gli+ NSCs were only observed to asymmetrically divide and Hopx+ NScs to symmetrically self-renew and asymmetrically divide. Numbers refer to publications (see reference list).

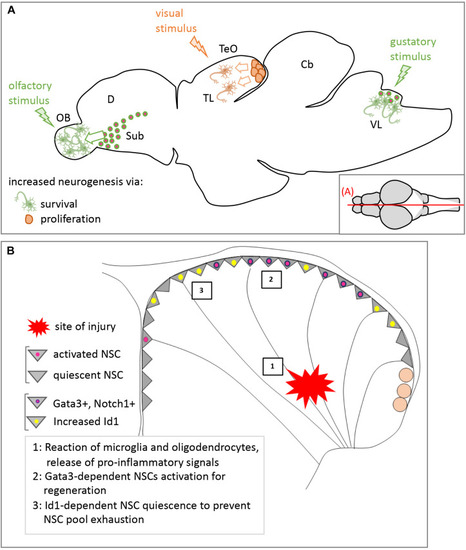
Modulation of adult neurogenesis by external stimuli in zebrafish. (A) Influence of sensory stimuli. Representation on a schematic sagittal section of the effect of the different sensory modalities studied to date, which can module either neuronal survival (green) or proliferation of NE progenitors (orange). (B) Influence of a mechanical injury on pallial neurogenesis. Representation on a schematic pallial cross-section of the sequence of events following injury (1–3) and the changes in NSC state and gene expression (color-coded). See text for references. Cb, cerebellum; D, dorsal part of the telencephalon; OB, olfactory bulb; Sub, subpallium; TeO, tectum opticum; TL, torus longitudinalis; VL, vagal lobe.

Acknowledgments
This image is the copyrighted work of the attributed author or publisher, and ZFIN has permission only to display this image to its users. Additional permissions should be obtained from the applicable author or publisher of the image. Full text @ Front Cell Dev Biol