FIGURE SUMMARY
Title

BE4max and AncBE4max Are Efficient in Germline Conversion of C:G to T:A Base Pairs in Zebrafish

Authors
Carrington, B., Weinstein, R.N., Sood, R.
Source
Full text @ Cells

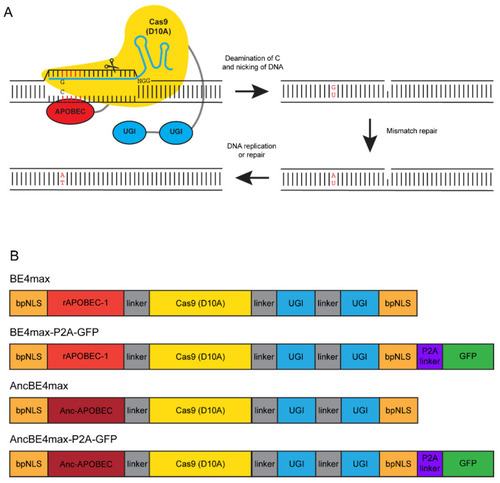
An overview of C → T conversion by BE4 and cytosine base editors used in this study. (A) A schematic of base editing depicted as conversion of C to T by BE4. The base editor is localized to the target DNA with a sgRNA (blue line and hairpins). Cytidine deaminase APOBEC-1 (red) performs deamination of the C to U and the Cas9n (yellow) nicks the unedited strand. Two copies of UGI (blue) are used to prevent removal of U and subsequent endogenous DNA mismatch repair and replication leads to C → T conversion as depicted. (B) A linear representation listing various components of BE4max or AncBE4max with and without GFP set of plasmids used in this study (based on [40]). bpNLS stands for bipartite nuclear localization signal.

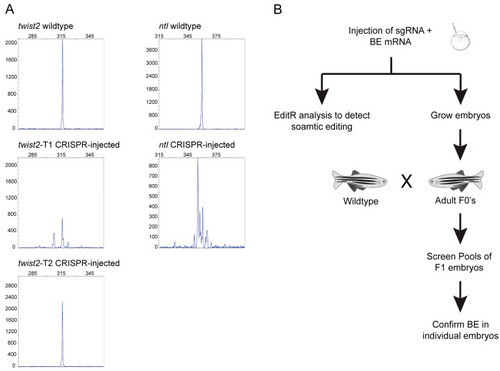
Selection of targets and strategy for assessment of base editing efficiency. (A) Evaluation of sgRNA targets by CRISPR-STAT. Peak profiles from representative wildtype (uninjected) or sgRNA-injected embryos are shown. twist2-T1 and ntl sgRNAs showed multiple peaks indicating DSB/NHEJ repair, whereas twist2-T2 showed no DSB/NHEJ activity. (B) Schematic of workflow for screening zebrafish at the somatic and germline levels. Injected embryos were screened using sequencing and EditR analysis for somatic base editing and additional progeny were grown to adulthood. Adult fish were then screened for germline transmission by outcrossing with wildtype fish and screening by sequencing pools of four embryos followed by confirmation of base editing in individual embryos.

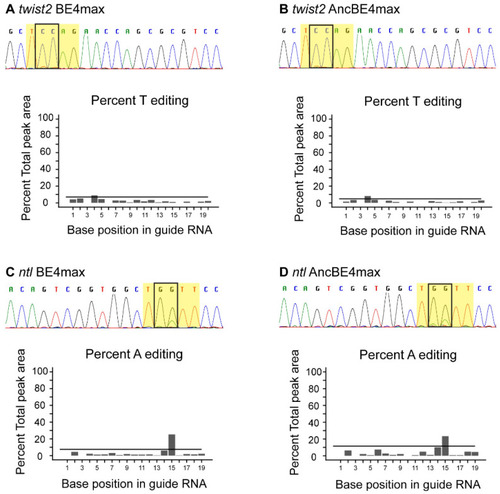
Somatic base editing with BE4max and AncBE4max. (A,B) somatic base editing at twist2 locus with BE4max (A) and AncBE4max (B). (C,D) somatic base editing at ntl locus with BE4max (C) and AncBE4max (D). In all panels, partial sequence chromatograms of representative embryos are shown with the target window highlighted in yellow and target nucleotides boxed. EditR Quad plots for the expected edited allele are shown below each chromatogram. These plots show the percent editing (Y-axis) at each nucleotide by base position (X-axis), with a horizontal line representing the p-value cutoff of 0.01. Any nucleotide above this cutoff is considered a real secondary peak. Expected base pair changes are C → T for twist2 or G → A for ntl (ntl sgRNA is on the reverse strand and orientation shown here is to depict the open reading frame).

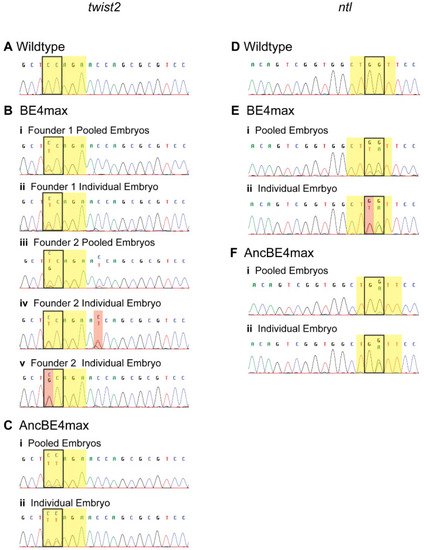
Germline base editing in pooled or individual embryos. Representative chromatograms of a wildtype embryo (A,D), pooled or individual F1 embryos at the twist2 (B,C) and ntl (E,F) loci are shown with the target window highlighted in yellow and target nucleotides boxed. Correct base editing for twist2 (C → T) and ntl (G → A) is observed as a trace peak in pooled embryos or as heterozygous peaks in individual embryos (ntl sgRNA is on the reverse strand and orientation shown is to depict the open reading frame). Incorrect bp changes and bystander edits are highlighted in red.

Acknowledgments
This image is the copyrighted work of the attributed author or publisher, and ZFIN has permission only to display this image to its users. Additional permissions should be obtained from the applicable author or publisher of the image. Full text @ Cells