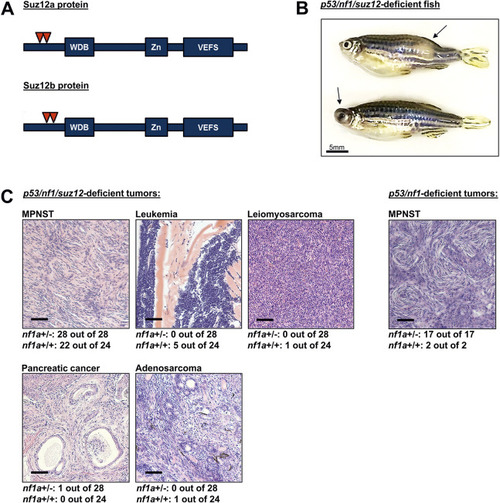
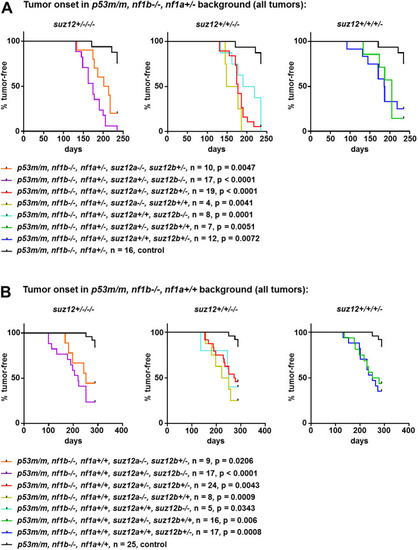
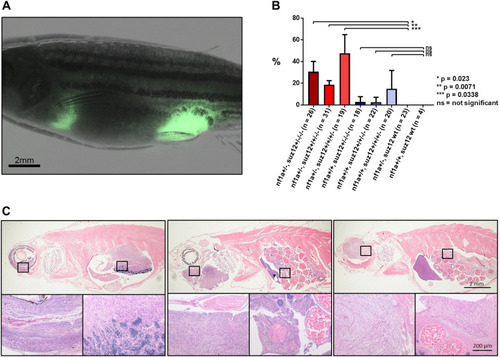
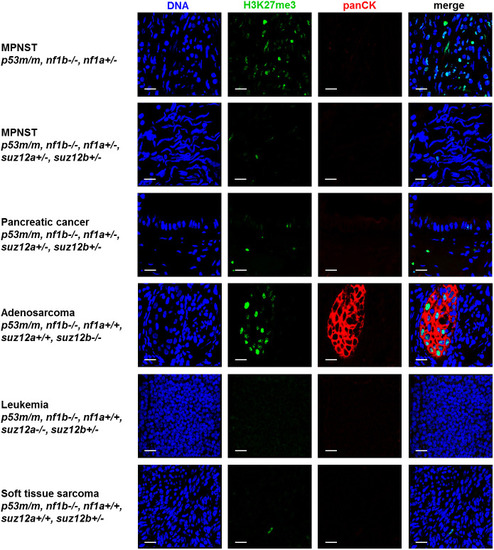
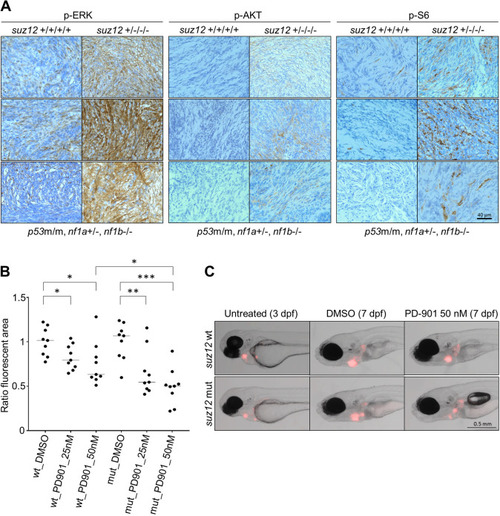
Loss of suz12 in p53/nf1-deficient fish diversifies carcinogenesis. (A) CRISPR-Cas9-mediated targeting truncates Suz12a and Suz12b proteins before their functional domains, conferring a loss of function. VEFS, VRN2-EMF2-FIS2-SUZ12 domain; WDB, WD-40 binding domain; Zn, Zn-finger region. (B) p53/nf1/suz12-deficient fish are prone to tumors in various anatomical locations, e.g. the abdomen or head (arrows). (C) Histopathology analysis reveals a variety of cancer types in p53/nf1/suz12-deficient tumor-bearing fish, whereas p53/nf1-deficient control fish solely develop MPNSTs. Numbers underneath representative images indicate the frequency of the respective tumor type in nf1a+/− or nf1+/+ tumor-bearing fish analyzed by histology. Scale bars: 100 µm.

Tumor watch of suz12-mutant fish in the p53m/m, nf1b−/−, nf1a+/ andp53m/m, nf1b−/−, nf1a+/+ backgrounds. Representative experiments are displayed to show tumor onset time for fish with nf1a+/− genotype (A) or nf1a+/+ genotype (B), plotted by suz12 genotype; either three out of four (suz12+/−/−/−; left), two out of four (suz12+/+/−/−; middle), or one out of four (suz12+/+/+/−; right) suz12 alleles are knocked out. The data from each knockout population was compared to the respective suz12-wild-type control population to calculate P-values using Student's t-tests.

Observation of multiple tumor foci in p53/nf1/suz12-deficient zebrafish lines. (A) Fluorescence microscopy image of an adult p53+/−, nf1b−/−, nf1a+/, suz12a+/, suz12b+/ fish bearing two independent GFP-positive tumors in abdominal and anal locations. (B) Proportion of fish with multiple lesions in different suz12-mutant populations with additional p53+/−, nf1b−/−, nf1a+/ or p53+/−, nf1b−/−, nf1a+/+ backgrounds. Data are mean±s.d. of populations with any combination of three out of four (suz12+/−/−/−), two out of four (suz12+/+/−/−), or one out of four (suz12+/+/+/−) suz12 alleles knocked out. The total number of fish analyzed is indicated (n). P-values were calculated using Student's t-tests. (C) Representative HE-stained sections of p53/nf1/suz12-deficient fish with two separate tumor foci. Squares indicate areas shown in magnified images below.

Analysis of H3K27me3 and pan-cytokeratin by indirect immunofluorescence and confocal microscopy. Paraffin-embedded sections of the indicated tumor types from zebrafish with the genotypes indicated were stained for H3K27me3 (green) and pan-cytokeratin (panCK; red). DNA is visualized using Hoechst 33342 (blue). Scale bars: 10 µm.

Evaluation and inhibition of the Ras signaling pathway in suz12-mutant and suz12-wild-type MPNSTs. (A) Immunohistochemistry analysis of signaling in three individual suz12-mutant (suz12+/−/−/−) and suz12-wild-type (suz12+/+/+/+) MPNSTs (n=3) each stained for phosphorylation of ERK, AKT, and S6 (p-ERK, p-AKT, and p-S6), indicating activation of Ras signaling. (B) The suz12a+/−, suz12b−/− (mut) or suz12-wild-type control MPNST (wt) tumor cell growth in the pericardial cavity of implanted embryos. These embryos were treated with DMSO vehicle control or PD-3025901 (PD901; 25 or 50 nM) (n=9 fish per treatment, doses based on the maximum tolerated dose of the individual drug). The fluorescent tumor area was determined for each embryo at 3 dpf (pre-treatment) and 7 dpf (post-treatment), and was reported as the normalized ratio of the red fluorescent area at 3  dpf versus 7 dpf in individual embryos. Individual values with medians (black bars) are shown. *P<0.05, **P=0.0064, ***P<0.0001 (Student's t-test). (C) Representative fish images at 3 dpf and 7 dpf after DMSO control or 50 nM PD0325901 treatment.

Acknowledgments
This image is the copyrighted work of the attributed author or publisher, and ZFIN has permission only to display this image to its users. Additional permissions should be obtained from the applicable author or publisher of the image. Full text @ Dis. Model. Mech.