FIGURE SUMMARY
Title

Embryonic tissue differentiation is characterized by transitions in cell cycle dynamic-associated core promoter regulation

Authors
Wragg, J.W., Roos, L., Vucenovic, D., Cvetesic, N., Lenhard, B., Müller, F.
Source
Full text @ Nucleic Acids Res.

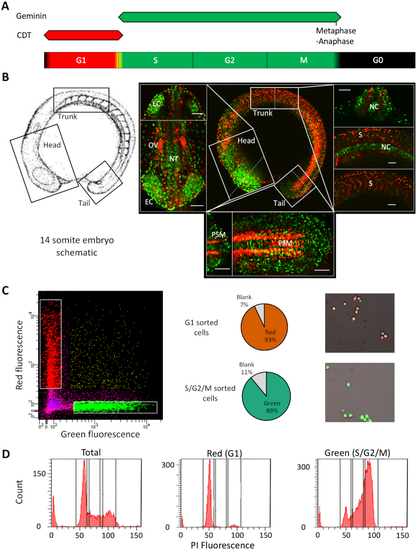
FACS mediated separation of cells by cell cycle stage in the developing embryo. (A) Schematic of fluorescence from the FUCCI system through the cell cycle with colours indicating phases marked by the fluorescent reporter genes. (B) Left panel; a schematic of the 14-somite embryos, reproduced with permission from (15) (© 1995 WILEY-LISS, INC.). Right panel; center: max projection fluorescent image of a 14-somite FUCCI transgenic embryo, showing the distribution of rapidly (green) and slowly cycling (red) cells. Surrounding panels: higher magnification views of the head, trunk and tail regions with alternate views shown in the top/right sections and cross-sections (denoted by the dashed lines) shown in the bottom/ left sections of each surrounding panel. Scale bar = 50 uM. Abbreviations, otic vesicle (OV), eye cup (EC), notochord (NC), somites (S), neural tube (NT), pre-somitic mesoderm (PSM). (C) FACS sorting of FUCCI embryos, from left to right, FACS plot showing gating, pie charts showing cell selection efficiency and representative fluorescent images of isolated cells. (D) Propidium Iodide DNA content analysis of isolated cells. FACS traces show a shift in isolated cell DNA content from a level in accordance with primarily Gap phase 1 cells (G1) (gated as P3) in the red population to principally S and G2 phase cells (gated in P4 and 5) in the green population, emanating from a mixed total population. Proportions are shown in Supplementary Table S1.

Overview of CAGE samples. (A) Histogram plots of the interquantile width of each Tag Cluster (TC). (B) UCSC genome browser view of si:ch211-113a14.29 (an orthologue of human histone 2B) and mmp30 (matrix metallopeptidase 30) showing consistent TSS distribution between nanoCAGE and published traditional CAGE. The position of putative regulatory motifs driving transcription are marked with distance from start of motif to dominant TSS position quantified. (C) A visualization of the overlap of TCs between the samples. The number of unique genes shared per group is shown in the lower half of the graph. (D) The number of TCs per sample mapping to genomic features. ‘Exon’, ‘5′ UTR’, ‘3′ UTR’ and ‘intron’ locations were extracted from the DanRer7 genomic build. ‘Promoter (≤1kb)’ = window 0–1 kb upstream of the gene start site, ‘Promoter (1–3 kb)’ = 1–3kb region upstream of gene start, ‘Downstream <3 kb’ = window 0–3 kb downstream of the gene end annotated in the DanRer7 genomic build and ‘Distal intergenic’ = all regions not covered in other classifications.

Classification of genes differentially expressed between G1 and S/G2/M segregated cells. (A) Volcano plot of all consensus clusters (CCs) in known promoter regions, coloured by significance. Location of genes shown in Figure 2B as well as the identity of top significant differentially expressed genes between populations highlighted by circles and gene names. (B) Bar plot of the percentage of promoters overlapping a human annotated cell cycle periodic gene from Cyclebase for each differentially expressed group and the CCs unchanged between the two groups. Left panel, full sample groups (n = 138, 190 and 8406, S/G2/M, G1 and unchanged respectively). Right panel, cell cycle periodic genes (n = 43, 6 and 246, S/G2/M, G1 and unchanged respectively). (C) Box plot of tissue specificity scores, based on adult zebrafish tissue for genes upregulated in G1 and S/G2/M and unchanged. (D) Anatomical specificity scores, based on expression in embryonic zebrafish tissues, for genes upregulated in G1 and S/G2/M. Left panel, anatomical specificity scores across development with key stages marked on x-axis. Right panel, anatomical specificity scores around stage at which the samples were collected (14-somite). Grey shading marks standard error, dashed line marks 14–19 somite stage. (E) Gene ontology of biological processes with their corresponding P-values.

Core promoter architecture. (A) Heatmap visualizing the log2 odds ratio of occurrence of core promoter motifs between genes upregulated in G1 and S/G2/M and unchanged (*P< 0.05, **P< 0.01, ***P< 0.001, Fisher's exact test). (B) Distribution of position weight matrix (PWM) match (%) to TATA-box in the region –40 to –20 bp upstream of the dominant TSS in genes upregulated in S/G2/M and G1 populations. (C) A/T pentamer relative occurrence 20 to 40 bp upstream of TSS of genes upregulated in S/G2/M (green), G1 (red) and unchanged expression (grey). Ordering of pentamers is by best-fit match to the TATA PWM incremental thresholds shown. Pentamers significantly enriched in each group relative to pentamer occurrence in genes with unchanged expression (*P< 0.05, **P< 0.01, ***P< 0.001, Fisher's exact test). (D) Consensus cluster interquantile width in genes upregulated in S/G2/M (green) and G1 (red) and with unchanged expression (grey) visualized as a histogram. (E) Promoter shape distribution per group. Classifications; sharp (at least 90% of the expression from the promoter emanating from TSSs within 10bp of one another (IQW < 10) and ≥60% of expression emanating from a single dominant TSS); Sharp with broad background (≥60% of expression emanating from a single dominant TSS, but IQW ≥ 10) and Broad (<60% of expression emanating from a single dominant TSS and IQW ≥ 10).

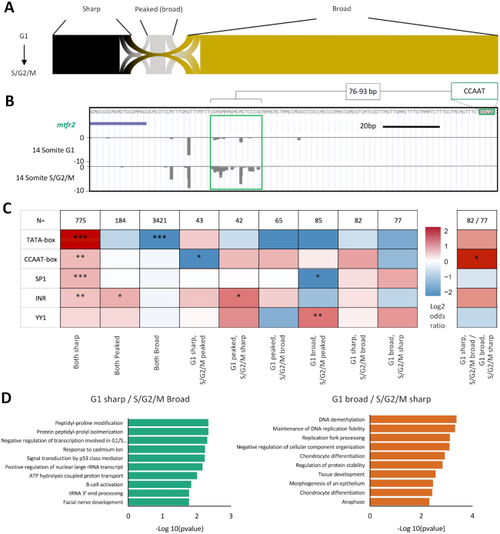
Core promoter shape transition. Promoter interquantile width (IQW) was measured and dominant TSSs assigned for consensus clusters (CCs) with at least 10 tpm expression in both the G1 and S/G2/M populations (n = 4774). Promoters were segregated into three groups based on promoter TSS distribution (shape), sharp (IQW < 10 bp), peaked broad (IQW > 10 bp, dominant TSS > 60% of CC expression) and broad (IQW > 10 bp, dominant TSS <60% of CC expression). (A) Sankey plot of promoter shape correspondence between G1 and S/G2/M. (B) UCSC genome browser view of the mitochondrial fission regulator 2 (mtfr2) promoter with a shape change transition between populations, broadening TSS distribution in the S/G2/M population versus G1. A proximal regulatory element (CCAAT-box) is highlighted along with its spatial proximity to the main region of differential TSS utilization in this promoter (green box). (C) Heatmap visualizing the log2 odds ratio of selected promoter motif occurrence for promoters transitioning in shape. Left heat map, occurrence is scored in each group versus the rest of the dataset of shared CCs >10 tpm expression (n = 4774). Right heatmap, comparison is as shown (*P< 0.05, **P< 0.01, ***P< 0.001, Fisher's exact test). (D) Gene ontology of biological processes of genes with promoters transitioning from sharp to broad between populations, with corresponding P-values shown.

Alternative promoter usage. TPM values were determined for genomic regions identified in Nepal et al. (31) to correspond to canonical and alternative promoters, associated with the same genes (n = 1612). Genes with significant expression (TPM > 5 in either the canonical or alternative promoter region in both the G1 and S/G2/M populations) were taken for further analysis (n = 231). (A) Plot of correlation of alternative promoter utilization, normalized to canonical promoter expression, between G1 and S/G2/M populations. Dashed lines denote threshold of 2-fold change in normalized alternative promoter expression between the populations (n = 79). These differentially utilized genes were segregated by whether a change in the expression of the canonical or alternative promoter, in either population, was responsible for the 2-fold change in the expression of the alternative promoter, normalized to canonical promoter expression. (B) Diagrammatic summary of group selection criteria. In brief, relative to the G1 population; Canonical down: S/G2/M alternative promoter expression unchanged, but canonical expression depleted (n = 12); Alternative down: S/G2/M alternative promoter expression depleted, but canonical expression unchanged (n = 22); Canonical up: S/G2/M alternative promoter expression unchanged, but canonical expression enhanced (n = 10); Alternative up: S/G2/M alternative promoter expression enhanced, but canonical expression unchanged. Situations falling outside of these criteria were discarded (n = 9). Full selection criteria shown in materials and methods. (C) Heatmap visualizing the log2 odds ratio of selected promoter motif occurrence for each group. Occurrence is scored in each group vs. occurrence in the rest of the data set (n = 80) (*P< 0.05, **P< 0.01, ***P< 0.001, Fisher's exact test). (D) UCSC genome browser view of the inositol polyphosphate-5-phosphatase B (inpp5b) promoters with CAGE-seq tracks showing enhanced alternative promoter usage in the S/G2/M population versus G1, an example of a member of ‘Alternative up’ group. The position of a CCAAT motif relative to the alternative promoter is shown. RNA-seq tracks, imported from the ‘Promoterome CAGE and nucleosome positioning’ publicly available trackhub (URL: http://trackhub.genereg.net/promoterome/danRer7/index.html) (17,31) show that this alternative promoter drives a somitogenesis specific transcript.

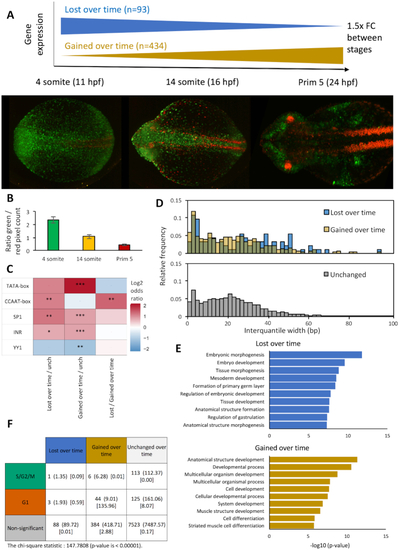
Genes with opposing temporal expression dynamics are marked by differential promoter motif utilization and TSS distribution. Published CAGE data from (30,31) was processed to generate a differential expression and promoter behaviour matrix for 4-somite, 14-somite and prim-5, three stages of zebrafish segmentation with differing ratios of rapid to slowly cycling cells, as demonstrated by Fucci imaging (A) and fluorophore pixel ratios (B). (A) Relative expression analysis of consensus clusters with a TPM > 5 in at least one time stage was performed. Genes where expression changes in the same direction by >1.5 fold in each sequential time stage were selected for further analysis and divided into gene where expression is lost over time (n = 93) and gained over time (n = 434) (4 somite → 14 somite [11–16 h post fertilization]→ Prim 5 [24hpf]). (B) Bar graph showing ratio of green / red fluorophore pixel density from imaged Fucci embryos at 4 and 14 somite and Prim 5 stages. (C) Heatmap visualizing the log2 odds ratio of selected promoter motif occurrence for genes with expression lost, or gained over time versus genes with no temporal dynamics (n = 7762) (*P< 0.05, **P< 0.01, ***P< 0.001, Fisher's exact test). (D) Consensus cluster interquantile width (IQW) in genes with expression lost (blue, mean IQW: 27.5), gained (yellow, mean IQW: 23.0) over time, or no temporal expression dynamics (grey, mean IQW: 22.8), visualized as a histogram. IQW was taken from the developmental stage where consensus cluster expression was highest. (E) Gene ontology analysis of genes with expression lost / gained over time. (F) Table showing chi-square intersection analysis between gene sets with temporal dynamics over the segmentation period of zebrafish development and cell cycle dynamics during the 14 somite stage. Data format: expected intersection size (chi-square statistic).

Acknowledgments
This image is the copyrighted work of the attributed author or publisher, and ZFIN has permission only to display this image to its users. Additional permissions should be obtained from the applicable author or publisher of the image. Full text @ Nucleic Acids Res.