
- Title
-
LIN28B regulates transcription and potentiates MYCN-induced neuroblastoma through binding to ZNF143 at target gene promotors
- Authors
- Tao, T., Shi, H., Mariani, L., Abraham, B.J., Durbin, A.D., Zimmerman, M.W., Powers, J.T., Missios, P., Ross, K.N., Perez-Atayde, A.R., Bulyk, M.L., Young, R.A., Daley, G.Q., Look, A.T.
- Source
- Full text @ Proc. Natl. Acad. Sci. USA
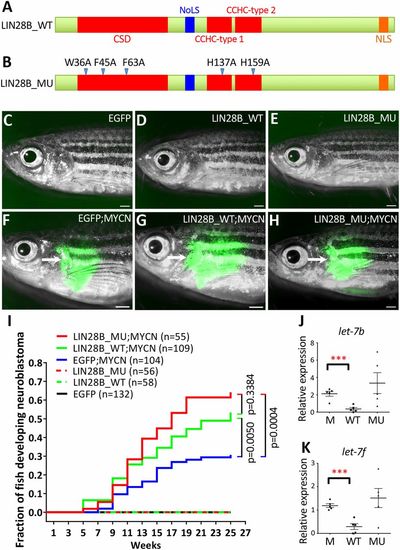
Overexpression of WT or mutant LIN28B increases the penetrance of MYCN-induced neuroblastoma. (A and B) Schematic of the WT (A, LIN28B_WT) and mutant (B, LIN28B_MU) human LIN28B proteins. CSD; NoLS, nucleolar localization signal; CCHC zinc-finger domain; NLS, nuclear localization signal. Five point mutations (arrowheads) were created in the LIN28B_MU. (C–H) Lack of detectable EGFP expression in the IRG of a 17-wpf EGFP transgenic fish (C) and 39-wpf LIN28B_WT (D) and LIN28B_MU (E) fish; and EGFP expression in the tumors (arrows) arising from the IRG of 17-wpf EGFP;MYCN (F), LIN28B_WT;MYCN (G) and LIN28B_MU;MYCN (H) fish. (Scale bar, 1 mm.) (I) Kaplan–Meier analysis of cumulative frequency of neuroblastoma in transgenic lines. Statistical analysis was performed using the logrank test. (J and K) The relative expression of zebrafish let-7b (J) and let-7f (K) miRNAs in EGFP;MYCN (M), LIN28B_WT;MYCN (WT), and LIN28B_MU;MYCN (MU) tumors by qRT-PCR. Five independent tumors from 6-mo-old fish were analyzed for each group. Each dot represents the expression levels of the indicated gene normalized to U6 snRNA. Horizontal bars indicate means ± SD. Statistical analysis was performed using the two-tailed unpaired t test. ***P < 0.001. |
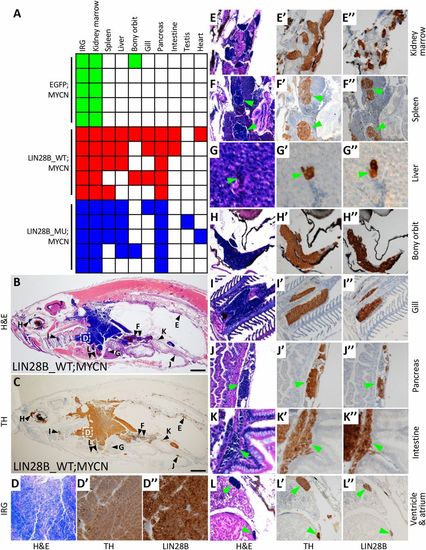
LIN28B promotes the metastasis of MYCN-induced neuroblastoma. (A) Summary of neuroblastoma metastases in EGFP;MYCN, LIN28B_WT;MYCN, and LIN28B_MU;MYCN transgenic lines at 6 mo of age, five fish per group. Colored boxes indicate that metastasis was observed in the indicated organ while white boxes indicate no apparent metastasis. The difference in metastases between EGFP;MYCN and either LIN28B_WT;MYCN or LIN28B_MU;MYCN fish (P = 0.0476) was compared using the two-tailed Fisher’s exact test. (B and C) Representative images of neuroblastoma metastases in the sagittal sections of LIN28B_WT;MYCN fish by H&E staining (B) and immunohistochemical staining of TH (C). The organs harboring metastatic tumor cells are marked in B and C and are correspondingly magnified in D–L″. (Scale bar, 1 mm.) (D–L″) Magnified views of the organs shown in B and C showing H&E staining as well as immunostaining of TH and LIN28B in LIN28B_WT;MYCN fish. Green arrowheads indicate metastatic cells. |
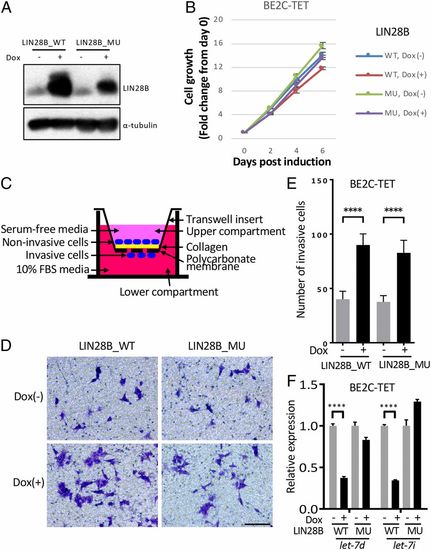
Both WT and mutant LIN28B promote cell invasion and migration in BE2C cells. (A) Western blotting of LIN28B_WT/MU using the BE2C-TET cells untreated or treated with 50 ng/mL doxycycline for 3 d. α-Tubulin was used as a loading control. (B) Relative cell growth of BE2C-TET cells untreated or treated with 50-ng/mL doxycycline. Values represent means ± SEM of triplicate experiments. (C) Schematic of transwell migration and invasion assay. (D and E) Transwell migration and invasion assay of the BE2C-TET cells untreated or treated with 50-ng/mL doxycycline. Cells were stained with 0.1% crystal violet (D), and the number of migrated cells through the membrane per field was compared with the two-tailed unpaired t test (E). Values represent means ± SD of triplicate experiments. ****P < 0.0001. (Scale bar, 100 µm.) (F) qRT-PCR to detect let-7d and let-7i expressions in BE2C-TET cells that were either untreated or treated with 50-ng/mL doxycycline for 3 d. Values were normalized to U6, U47, and RNU44 small nuclear RNAs and represent the means ± SD of triplicate experiments. Statistical analysis was performed using the two-tailed unpaired t test. ****P < 0.0001. |

WT and mutant LIN28B show similar genome-wide binding profiles and share a subset of common downstream targets. (A) Metagenes and heatmaps of genome-wide co-occupancy for endogenous LIN28B in BE2C cells as well as LIN28B_WT and LIN28B_MU in BE2C-TET cells treated with 50-ng/mL doxycycline for 3 d as determined by ChIP-seq. See Fig. 4D legend for detail. (B) Representative ChIP-seq tracks for H3K27ac, endogenous LIN28B and ZNF143, ATAC-seq tracks in BE2C cells, as well as ChIP-seq tracks for Flag-LIN28B_WT and Flag-LIN28B_MU in BE2C-TET cells treated with 50-ng/mL doxycycline for 3 d. See Fig. 4C legend for details. (C) Immunostaining images of Flag-LIN28B_WT/MU (green) in BE2C-TET cells treated with 50-ng/mL doxycycline for 3 d. Nuclei were stained with DAPI (blue). (Scale bar, 10 μm.) (D) Fold change (log2 of yDox/nDox) in gene expression following overexpression of LIN28B_WT or LIN28B_MU in BE2C-TET cells treated with doxycycline (yDox) versus untreated cells (nDox). Gene numbers within each group are indicated. (E and F) Venn diagrams of genes that were significantly (P < 0.01) up-regulated (E) or down-regulated (F) in doxycycline-treated LIN28B_WT or LIN28B_MU expressing BE2C-TET cells compared to untreated controls. (G) GSEA to determine the correlation of DNA binding with gene expression changes upon overexpression of LIN28B_WT or LIN28B_MU in BE2C-TET cells. The GSEA plot indicates the degree to which LIN28B and ZNF143 cobound genes are overrepresented at the extreme left (up-regulated by overexpression) or right (down-regulated by overexpression) of the entire ranked list. Solid bars represent LIN28B-bound genes. The green shading indicates the leading edge subset of genes. o/e, overexpression. (H) Heatmaps depicting the relative expression levels of high-confidence let-7–independent LIN28B target genes in BE2C-TET cells either untreated (nDox) or treated (yDox) with doxycycline. Each row corresponds to a gene, and signal intensity is normalized across the row. Genes are ranked by P value with the lowest at the top. |
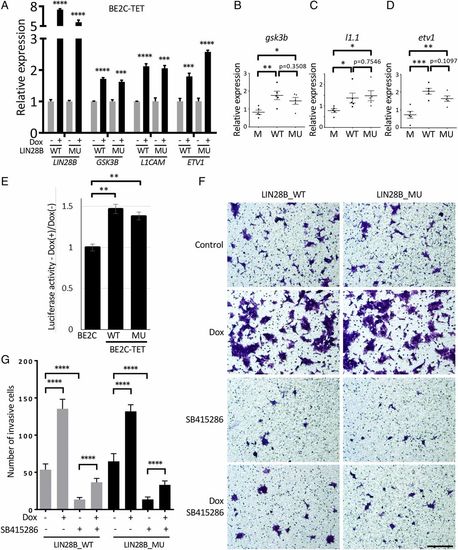
Expression of WT or mutant LIN28B reverses the cell invasion and migration defects induced by GSK3B inhibition. (A) qRT-PCR to detect LIN28B, GSK3B, L1CAM, and ETV1 expression in BE2C-TET cells that were either untreated or treated with 50-ng/mL doxycycline for 3 d. Values were normalized to EEF1A1, ACTB, and B2M and represent the means ± SD of triplicate experiments. (B–D) The expression of zebrafish gsk3b (B), l1.1 (C) and etv1 (D) mRNAs in EGFP;MYCN (M), LIN28B_WT;MYCN (WT), and LIN28B_MU;MYCN (MU) tumors was analyzed by qRT-PCR. Five independent tumors from 6-mo-old fish were analyzed for each group. Each dot represents the expression levels of the indicated gene normalized to EEF1A1. Horizontal bars indicate means ± SD. (E) The LIN28B- and ZNF143-binding sequences within the GSK3B promoter region were cloned upstream of the firefly luciferase reporter gene and transfected into BE2C or BE2C-TET cells expressing Flag-tagged LIN28B_WT (WT) or LIN28B_MU (MU) that were untreated or treated with doxycycline. A reporter construct encoding renilla luciferase under control of the cytomegalovirus promoter was cotransfected to normalize firefly luciferase values. Luciferase activities were measured 48-h posttransfection and expressed as a ratio of the cells treated with doxycycline to untreated controls. Values represent means ± SEM of triplicate experiments. (F and G) Transwell migration and invasion assay of the BE2C-TET cells untreated or treated with 50-ng/mL doxycycline or 25-μM GSK3B inhibitor SB415286. Cells were stained with 0.1% crystal violet (F), and the number of migrated cells through the membrane per field was plotted as means ± SD of triplicate experiments (G). (Scale bar, 100 µm.) All of the statistical analyses were performed using the two-tailed unpaired t test. *P < 0.05; **P < 0.01; ***P < 0.001; ****P < 0.0001. |