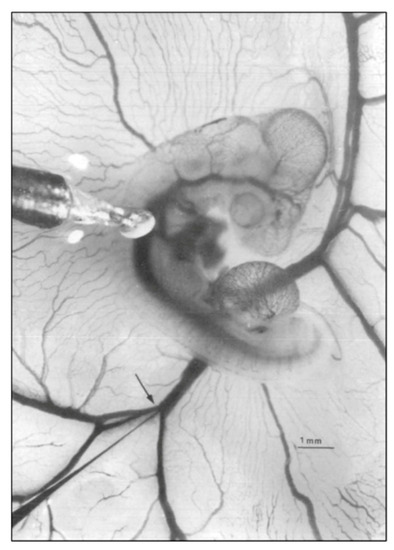
Representative photo of a stage 21 chick embryo for hemodynamic measurements. A 1-mm diameter piezoelectric crystal is positioned over the dorsal aorta at a 45 °angle and a 5 mm diameter tip glass micropipette is positioned in the left vitelline vein. Scale bar = 1 mm. This image was reproduced with permission [53].

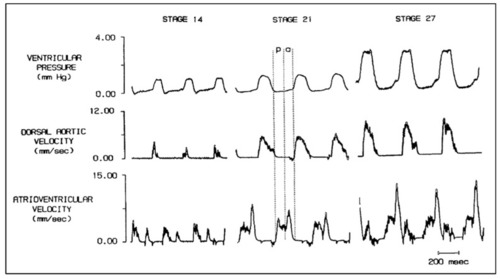
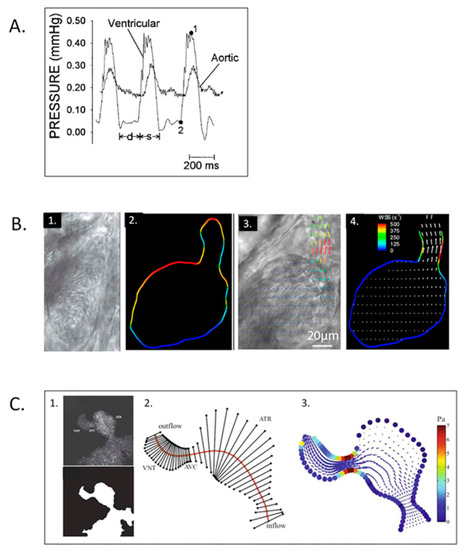
Simultaneous ventricular pressure, dorsal aortic velocity and atrioventricular velocity in stage 14, 21, and 27 chick embryos. Diastole is partitioned into the passive filling phase (p) followed by active ventricular filling due to atrial systole (a). Scale bar = 200 milliseconds (msec). This was reproduced with permission [56].

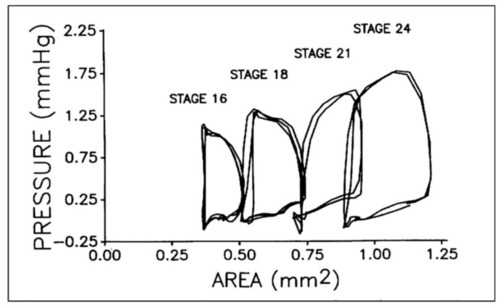
Representative pressure–area loops for stage 16 to 24 chick embryos. Two or three cardiac cycles are included for each stage as synchronized, raw data. This was reproduced with permission [93].

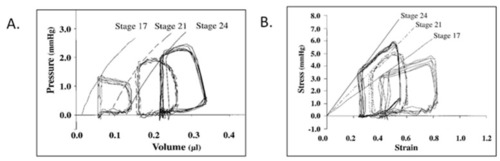
Representative pressure–volume (A) and stress–strain (B) loops for stage 17, 21, and 24 chick embryos. End-systolic pressure–volume relations were curvilinear, end-systolic stress–strain relations were linear, and end-systolic myocardial stiffness increased with development. This was reproduced with permission [97].

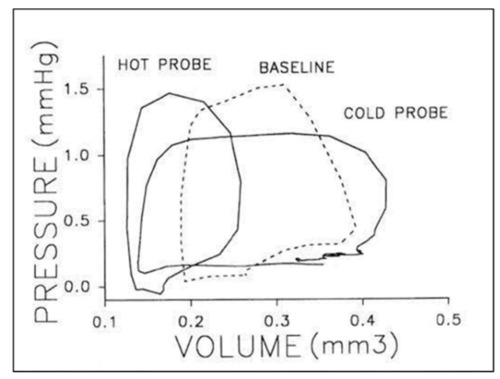
Representative pressure–volume loops for a stage 21 chick embryo at baseline (dashed line), intrinsic heart rate then in response thermal probe application to increased (hot) or decreased (cold) heart rate. Two or three cardiac cycles are included for each stage as synchronized, raw data. This was reproduced with permission [104].

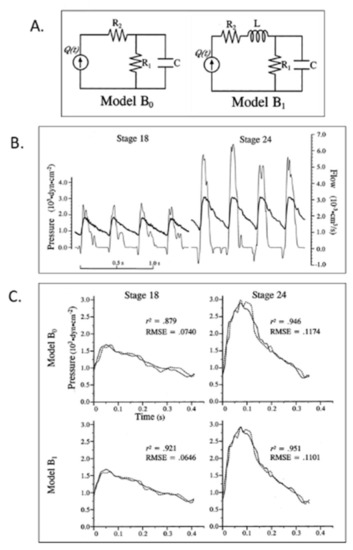
Lumped parameter Windkessel estimation of embryonic chick arterial impedance. (A) 3-element (B0) and 4-element (B1) lumped parameter models of the embryonic circulation as electrical circuit analogs; (B) representative time domain pressure and flow waveforms for stage 18 and 24 chick embryos. Bold lines represent pressure and thin lines represent blood flow data; (C) representative fit results based on models B0 and B1 for stage 18 and 24 data. Solid lines represent experimental pressure data and dashed lines represent model-predicted pressure waveforms. r2, the coefficient of determination; RMSE, root mean square error. This was reproduced with permission [102].

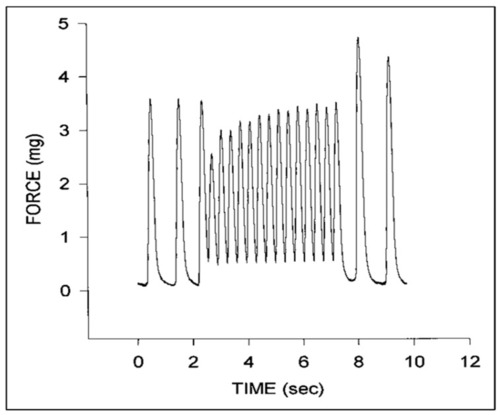
Representative force tracings for a stage 24 chick embryo myocardial specimen. Note the initial increase in diastolic force and decrease in systolic force at higher pacing rates that gradually increases with time and the increase in peak systolic force upon return to the intrinsic pacing rate. This was adapted with permission [123].

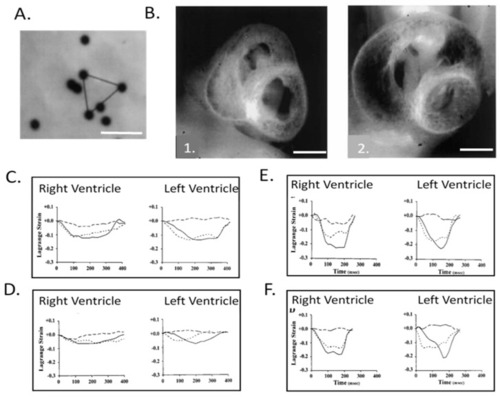
Right and left ventricular epicardial strains in normal and left heart hypoplasia chick embryos. (A) Representative video image of 10 μm diameter microspheres attached to the left ventricular (LV) epicardium of a stage 24 chick embryo. Epicardial strains were measured by tracking the motion of microspheres in triangular arrays. Scale bar = 50 μm. (B) Representative midventricular transverse sections for stage 27 normal (1.) and left-atrial ligated (LAL) (2.) chick embryos. Note the obvious increase in right ventricular (RV) and decrease in LV dimensions. Scale bar = 1 mm. (C) Representative developmental changes in strain–time curves for normal stage 21 chick ventricles; (D) stage 21 LAL chick ventricles; (E) stage 31 normal chick ventricles, and; (F) stage 31 LAL chick ventricles. Solid, broken, and dashed lines indicate epicardial circumferential, longitudinal, and shear strains, respectively. The x-axis is time (msec) and the y-axis is strain normalized to end-diastole. Note that from stage 21 to 31, the strain patterns change from isotropic to RV- and LV-specific anisotropic patterns and that LAL strains at stage 31 markedly differ from normal embryos. This was adapted with permission [134].

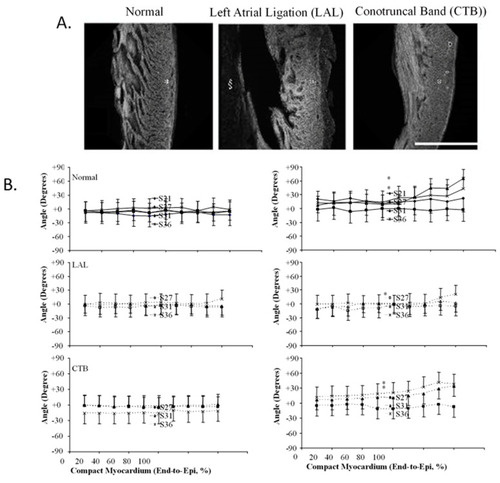
Three-dimensional myofiber architecture of the embryonic LV during normal development and altered mechanical loads. (A) Developmental change of the LV myocardial architecture in normal, left-atrial ligated (LAL), and conotruncal banded (CTB) embryos at stage 36. Scale bar = 500 μm. (B) Transmural myofiber angle distribution of the LV compact myocardium in normal, LAL, and CTB embryos. Data expressed as mean ± SD. Horizontal axis represents transmural coordinate of compact myocardium from endocardium (0%) to epicardium (100%). Asterisk, p < 0.05 by nonparametric ranking test vs. normal at the same developmental stage. This was adapted with permission [135].

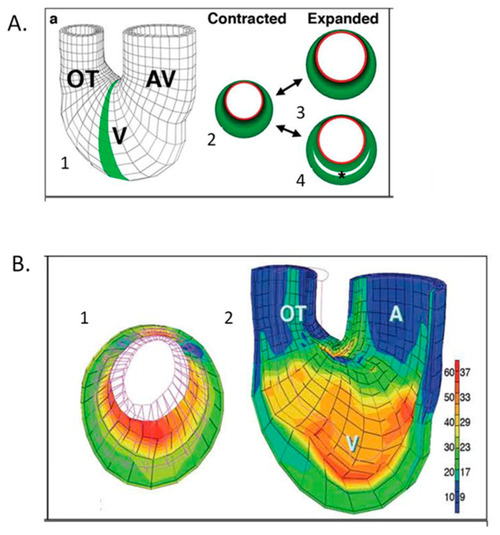
Computational modeling of embryonic heart wall strains. (A) Model and problem orientation. 1. Three-dimensional mesh diagram of tubular chick heart exterior with atrioventricular (AV) canal, ventricular (V) loop and outflow tract (OT) with the shaded 2D cross-sectional plane selected for further analysis; 2. diagramed in the contracted state with a subendocardial layer (red) and muscle cross-sectional area (green). Two plausible expanded states are shown for a solid wall (3) or a wall with trabecular spaces (4). (B) Finite element modeling of stage 21 chick heart with a four-layer mesh shows greater strain (red) along inner layers at maximal expansion. 1. (A) Two-dimensional section across the ventricular loop; 2. (A) Three-dimensional global mesh oriented as in A1 with the anterior half removed to show interior surfaces. The scale shows the percentage elongation of initially unloaded elements along the left, with corresponding fractional shortening (%) shown to the right. This was adapted with permission [136].

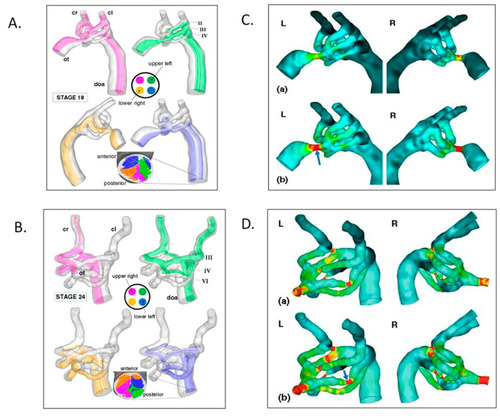
Aortic arch morphogenesis and flow modeling. (A) Representative mean flow path-lines using realistic geometries from micro-CT casts, fluorescent ink injections in a stage 18 chick embryo. Note that flow stream separation occurs through the aortic sac, arches, and dorsal aorta. (B) Representative mean flow path-lines using realistic geometries from micro-CT casts, fluorescent ink injections in a stage 24 chick embryo with similar flow stream separation. (C) Aortic sac and arch wall shear stress distributions at stage 18 for the left lateral (L) and right lateral (R) views. (D) Aortic sac and arch wall shear stress distributions at stage 24. This was adapted with permission [161].

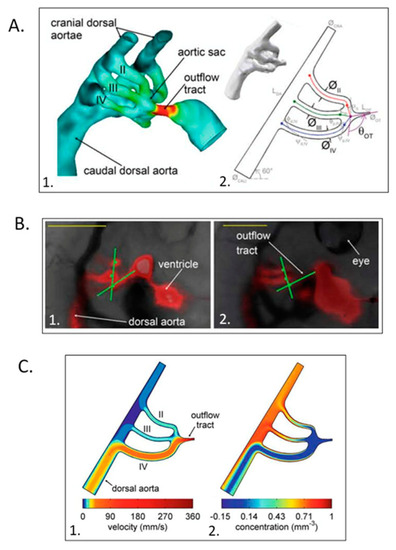
Computational hemodynamic optimization predicts embryonic chick aortic arch selection. (A) Three-dimensional polymeric cast of a stage 18 aortic sac and arches with color representing wall shear stress magnitudes (1.) and parameterized stage 18 right lateral aortic arch geometry (2.). (B) Representative fluorescent dye injections and angle measurements in stage 21 (1.) and stage 24 (2.) chick embryos. Scale bar = 1 mm. (C) Power + diffusion optimization predicts the selection of the aortic arch IV though arches II and III remain patent for an outflow tract angle of 102 ° and an energy/diffusion ratio of 1.85. This was adapted with permission [162].

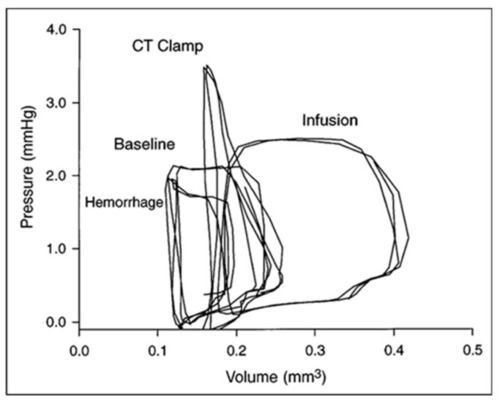
Ventricular–vascular uncoupling during acute conotruncal (CT) occlusion. Representative pressure–volume loops at baseline, during buffer infusion, and after CT clamp in a stage 21 chick embryo. Note the increased end-systolic pressure despite reduced stroke volume during CT clamp consistent with contractile reserve and only a modest increase in end-systolic pressure during infusion consistent with a curvilinear end-systolic PV relation. This was adapted with permission [98].

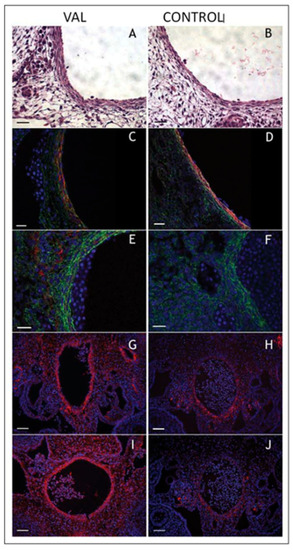
Increased arterial load via unilateral vitelline artery ligation (VAL) alters aortic structural properties. Representative images of VAL (A,C,E,G,I) and control (B,D,F,H,J) dorsal aortas stained with hematoxylin and eosin (A,B), and antibodies against smooth muscle α-actin (C,D), collagen type III (E,F), procollagen type I (G,H), and antibody M38 (I,J) show increased content in dorsal aorta and perivascular tissues in VAL embryos. Magnification is × 600 and scale bars are 20 µm for AF, and × 200 and 50 µm, respectively, for GJ. This was adapted with permission [221].

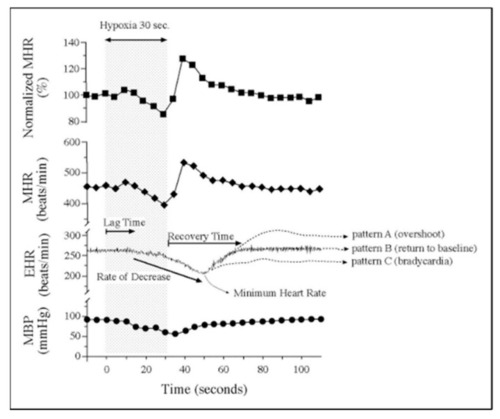
Embryonic vulnerability to acute maternal hypoxia. Representative maternal heart rate (MHR), embryonic heart rate (EHR), and maternal blood pressure (MBP) before, during, and after 30 s of maternal hypoxia via suspended ventilation. Lag time is defined as time from the onset of maternal hypoxia to the onset of bradycardia. Recovery time is defined as time from minimum EHR to return to baseline EHR. Patterns of EHR recovery are defined as (A) post-hypoxia tachycardia; (B) post-hypoxia return to baseline; and (C) post-hypoxia persistent bradycardia. Adapted with permission [234].

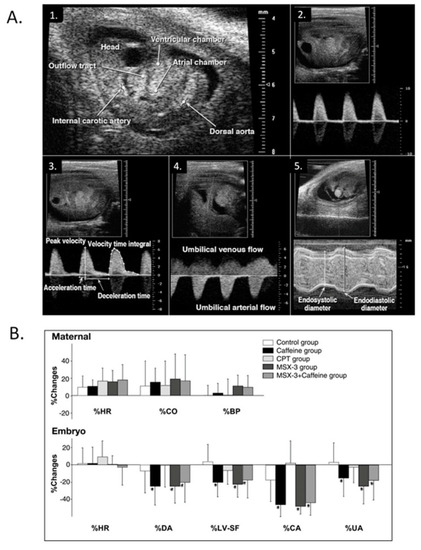
Modest maternal caffeine exposure affects murine embryonic cardiovascular function. (A) Representative in vivo high-frequency echocardiogram images and pulsed-Doppler waveforms from CD-1 mouse embryos. 1. B-mode image of an embryonic day (ED) 10.5 embryo. Arrowheads indicate velocity sampling locations; 2. dorsal aortic pulsed-Doppler velocity waveforms at ED 12.5. The scale on the right denotes Doppler velocity (cm/s); 3. internal carotid arterial pulsed-Doppler velocity waveforms at ED 12.5; 4. Umbilical arterial pulsed-Doppler velocity waveforms at ED 11.5; 5. M-mode image of an ED 11.5 embryonic LV planimetered to determine end-diastolic and end-systolic dimensions. This was adapted with permission (Momoi et al. 2007). (B) Representative changes in maternal and embryo hemodynamics 30 min after maternal treatment with caffeine (10 mg/kg), adenosine A1 selective antagonist 8-cyclopentyl-1,3-dimethylxanthine (CPT) (4.8 mg/kg), or adenosine A2A selective antagonist MSX-3 (3.0 mg/kg). Maternal HR, cardiac output (CO), and systolic blood pressure (BP) did not change from baseline in response to any treatment (top). MSX-3 mirrored the caffeine effects on embryonic hemodynamics (bottom), and no additive effects occurred by concurrent treatment of caffeine and MSX-3, suggesting that the negative CV effects of caffeine on embryonic hemodynamics occur via the adenosine A2A receptor. The values are mean ± SD and represent changes from baseline. *p < 0.05 vs. the control (ANOVA). This was adapted with permission [245].

Zebrafish embryo hemodynamics. (A) Representative ventricular and dorsal aortic pressure waveforms of a 5-day post-fertilization Zebrafish. D-diastolic and s-systolic time intervals, 1-ventricular peak pressure and 2-ventricular end-diastolic pressure. Scale bar = 200 msec. This was adapted with permission [261]. (B) Velocity and wall shear stress (WSS) measurements via digital particle image velocimetry for Zebrafish embryos. 1. Brightfield image for the ventricle of a 4-dpf Zebrafish embryo; 2. vessel boundaries are determined as the limits of cell movements; 3. velocity vectors for cell movements; 4. calculated wall shear rates overlaid with velocity vectors. This was adapted with permission [275]. (C) Coupled confocal imaging and computational modeling approach for Zebrafish heart hemodynamics. 1. Segmentation of the heart wall from maximum intensity projection of a confocal scan for a 48-hpf embryo; 2. cross-section segments through the heart and their intersection points with the wall. ATR, atrium; VNT, ventricle; AVC, atrioventricular canal; 3. velocity vectors and WSS levels from the in silico computational fluid dynamics (CFD) model at peak systole. Adapted with permission [275].

Acknowledgments
This image is the copyrighted work of the attributed author or publisher, and ZFIN has permission only to display this image to its users. Additional permissions should be obtained from the applicable author or publisher of the image. Full text @ J Cardiovasc Dev Dis