FIGURE SUMMARY
Title

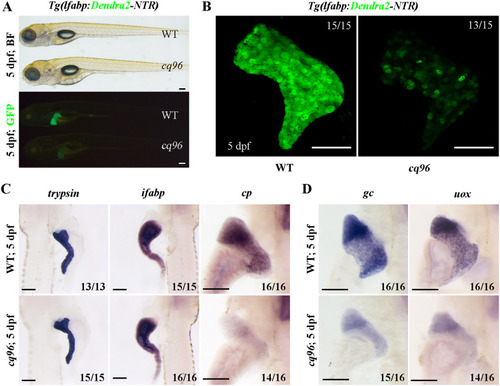
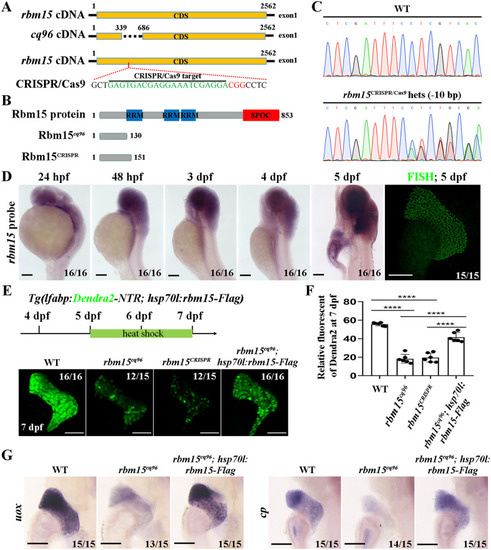
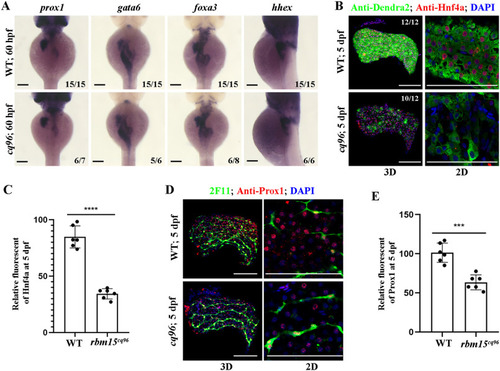
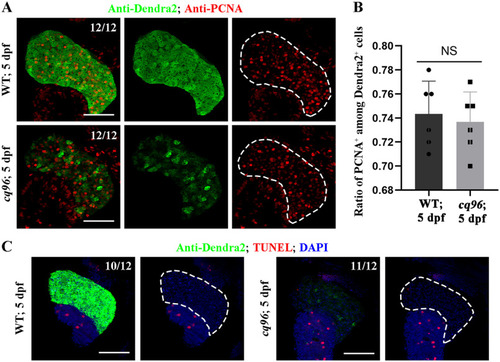
Loss of the RNA-binding protein Rbm15 disrupts liver maturation in zebrafish

Authors
Hu, L., Li, H., Chi, Z., He, J.
Source
Full text @ J. Biol. Chem.

ZFIN is incorporating published figure images and captions as part of an ongoing project. Figures from some publications have not yet been curated, or are not available for display because of copyright restrictions.

EXPRESSION / LABELING:
Gene:
Fish:
Anatomical Term:
Stage: Day 5
PHENOTYPE:
Fish:
Observed In:
Stage: Day 5

Zebrafish cq96 mutants display aberrant liver maturation. The liver was labeled by Tg(lfabp:Dendra2-NTR)cq1. A, bright field and green fluorescence image of WT and cq96 mutant at 5 dpf showing the morphology and liver fluorescence expression. B, confocal images of WT and cq96 at 5 dpf revealing the liver size and morphology. C, whole-mount in situ hybridization (WISH) results showing the expressions of trypsin, ifabp, and cp in WT and cq96 mutant at 5 dpf. D, evaluating the liver function by WISH results of uox and gc in WT and cq96 mutant at 5 dpf. BF, bright field. Numbers indicate the proportion of larvae exhibiting the expression shown. Scale bars, 100 μm.

The mutation gene in cq96 is rbm15.A and B, schematic drawing of the rbm15 locus, cq96, CRISPR/Cas9 targeting site (green), and the PAM sequence (red). C, genomic sequencing result of rbm15 mutation derived from the CRISPR/Cas9 knockout experiment. D, WISH and fluorescence in situ hybridization (FISH) results showing the expression pattern of rbm15 from 24 hpf to 5 dpf. E, heat shock transgenic line Tg(hsp70l:rbm15-Flagcq97) rescues liver defects of cq96; confocal images show the expression of Dendra2. F, the quantification of fluorescent intensity of Dendra2 in the liver. G, evaluating the rescue effects by detecting the expression of liver functional genes uox and gc via WISH. Numbers indicate the proportion of larvae exhibiting the expression shown. Asterisks indicate statistical significance: ****, p < 0.0001. Scale bars, 100 μm; error bars, S.D.

Hepatoblast specification is normal in the cq96 mutant.A, WISH results of gata6, prox1, foxa3, and hhex at 60 hpf revealing hepatic formation and specification in cq96 and WT. B, confocal images showing the antibody staining of Hnf4a and Dendra2 at 5 dpf in cq96 mutant. C, the quantification of Hnf4a fluorescent intensity in WT and cq96. D, confocal images showing the antibody staining of Prox1 and 2F11 in WT and mutant at 5 dpf. E, the quantification of Prox1 fluorescent intensity in WT and cq96. Numbers indicate the proportion of larvae exhibiting the expression shown. Asterisks indicate statistical significance: ***, p < 0.001; ****, p < 0.0001. Scale bars, 100 μm; error bars, S.D.

EXPRESSION / LABELING:
Genes:
Antibody:
Fish:
Anatomical Terms:
Stage Range: Pec-fin to Day 5
PHENOTYPE:
Fish:
Observed In:
Stage: Day 5

Loss of Rbm15 has no effect on hepatic proliferation and apoptosis.A, antibody staining results of PCNA and Dendra2 showing hepatocytes outside of the G0 phase at 5 dpf. B, quantification of the percentage of the PCNA+ among Dendra2+ cells at 5 dpf in WT and rbm15−/−. TUNEL assay images showing the apoptosis of liver in WT and rbm15−/− at 5 dpf. Numbers indicate the proportion of larvae exhibiting the expression shown. NS, not significantly different; scale bars, 100 μm; error bars, S.D.

Inhibiting the mTORC1 pathway partially rescues the liver maturation defects in rbm15cq96.A, confocal images (3D) showing the antibody staining of p-4Ebp1 and 2F11 to evaluate the activity of mTORC1 signal in hepatocytes at 5 dpf. B, rapamycin treatment and confocal images reflecting the rescue efficiency of rapamycin treatment. C, quantification of Dendra2 fluorescent intensity in WT, cq96, and rapamycin treatment. D, antibody staining results of Hnf4a and Dendra2 showing that rapamycin treatment affects the cellular and protein levels of Dnedra2 and Hnf4a. E, the quantification of Hnf4a fluorescent intensity in WT, cq96, and rapamycin treatment. F, WISH images showing the expression patterns of cp and gc after rapamycin treatment. rapa, rapamycin. The numbers indicate the proportion of larvae exhibiting the expression shown. Asterisks indicate statistical significance: ****, p < 0.0001. Scale bars, 100 μm; error bars, S.D.

Acknowledgments
This image is the copyrighted work of the attributed author or publisher, and ZFIN has permission only to display this image to its users. Additional permissions should be obtained from the applicable author or publisher of the image. Full text @ J. Biol. Chem.