
- Title
-
Long-Range Optogenetic Control of Axon Guidance Overcomes Developmental Boundaries and Defects
- Authors
- Harris, J.M., Wang, A.Y., Boulanger-Weill, J., Santoriello, C., Foianini, S., Lichtman, J.W., Zon, L.I., Arlotta, P.
- Source
- Full text @ Dev. Cell
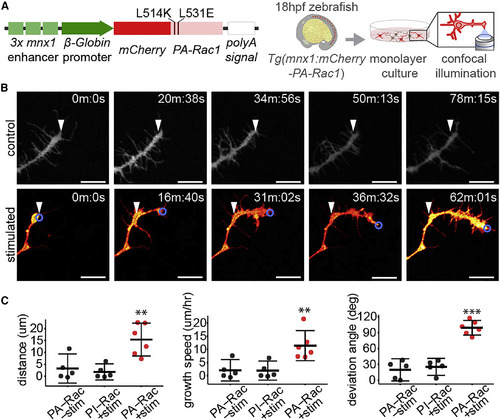
Optogenetic Stimulation of PA-Rac1 Directs Axonal Growth of Cultured Zebrafish Spinal Motor Neuron Axons (A) Schematic of expression construct and experimental design. (B) Time series of cultured PA-Rac1+ neurons, either unstimulated (top row) or illuminated in a region of interest focused on the leading edge of the growth cone (blue circle) (bottom row). White arrowheads indicate the initial position of the growth cone (scale bar, 10 μm). (C) Stimulated axons (n = 5 axons from separate cultures of independent embryos) grew significantly greater distances over the trial period (left), resulting in a faster rate of growth (middle), and deviated significantly from their initial trajectory compared with unilluminated PA-Rac1+ axons or illuminated photo-insensitive Rac1+ (PI-Rac1) axons (right, independent samples Student’s t test, ∗∗p < 0.01, ∗∗∗p < 0.001. Mean and 95% CIs shown). See also Figure S1; Video S1. |
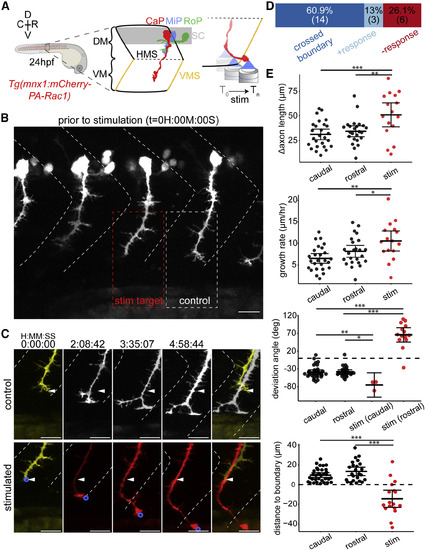
Optogenetic Stimulation of PA-Rac1 Directs Zebrafish CaP Axon Growth across the Repulsive Somitic Boundary into the Neighboring Somitic Musculature (A) Schematic of experimental design: zebrafish expressing PA-Rac1 in CaP neurons (left) were illuminated at the leading edge of the growth cone from 24 to 29 hpf (right). (B) Position of axons prior to stimulation. All CaP neurons were within the somitic boundaries (dashed white chevrons). A single CaP axonal growth cone per fish (red box) was asymmetrically illuminated, whereas other CaP neurons, including the rostral neighbor (white box), remained unilluminated (scale bar, 20 μm). (C) Time series of CaP axons in an unstimulated rostral axon (upper series, corresponding to white dashed box in B) and illuminated CaP axon (lower series, corresponding to red box in B). The stimulated axon was guided across the rostral somitic boundary, whereas the unstimulated axon remained entirely within its native somite (arrowheads indicate the initial position of the axon; scale bar, 20 μm). (D) Distribution of outcomes of optogenetic stimulation. Axons either grew across repulsive vertical myosepta boundaries in response to illumination (dark blue, crossed boundary), grew in the direction of illumination but did not cross the vertical myosepta (light blue, + response), or did not alter their growth trajectory following illumination (red, - response). (E) PA-Rac1-mediated guidance of CaP axons in vivo resulted in significantly longer axons over the trial period, corresponding to faster axonal growth (top two graphs, respectively, n = 16 axons, one axon per zebrafish). The angle of axon growth deviated significantly in both the rostral and caudal directions from their initial trajectory compared with unilluminated controls (middle). Stimulated axons were guided across the somitic boundary, which control axons never crossed (bottom, negative values indicate growth across the somitic boundary, [FDR adjusted, difference of least square means from mixed linear model, n = 17 axons, one axon per fish, ∗p < 0.05, ∗∗p < 0.01, ∗∗∗p < 0.001], mean and 95% CIs shown). R, rostral; C, caudal; D, dorsal; V, ventral; DM, dorsal myotome; SC, spinal cord; VM, ventral myotome; HMS, horizontal myoseptum; VMS, vertical myoseptum; CaP, MiP, and RoP, caudal, middle, and rostral primary spinal motor neurons, respectively. See also Figure S1; Video S2. |
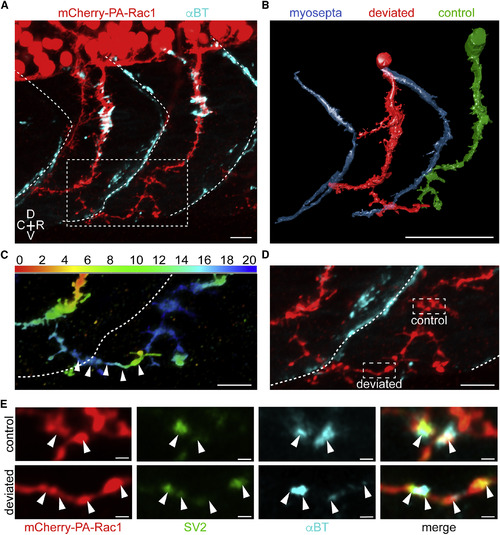
Molecular Investigation of Novel Neuromuscular Synaptic Formation between Ectopically Directed CaP Neuron and Foreign Myotomes (A) Z projection of a zebrafish CaP neuron (red) deviated across a somitic boundary (dashed white line), revealed by α-bungarotoxin staining (cyan; scale bar, 10 μm). (B) A 3D rendering from confocal stacks of the deviated (red) and neighboring control (green) axon in (A) with the somitic boundary (blue; scale bar, 50 μm) (see also Video S3). (C) The axonal segments in the white dashed box in (A), pseudocolored to reflect Z position of the deviated CaP axon (white arrowheads), which passed lateral to the neighboring rostral CaP neuron (scale bar, 10 μm). (D) Same region as (C), showing the locations of the regions of interest in (E) on the unstimulated CaP axon (dashed white box, control) and the invading CaP axon (dashed white box, deviated; scale bar, 10 μm). (E) Immunohistochemistry of regions of interest in (D) for mCherry-PA-Rac1 (red), SV2 (green), and αBT (cyan) for the unstimulated control axon (top) and stimulated axon deviated across the somitic boundary (bottom). White arrowheads illustrate the colocalization of pre- and post-synaptic markers, suggesting the presence of synapses (n = 3 fish, Costes p value > 0.95; scale bar, 1 μm). R, rostral; C, caudal; D, dorsal; V, ventral. See also Figure S2, Video S3. |
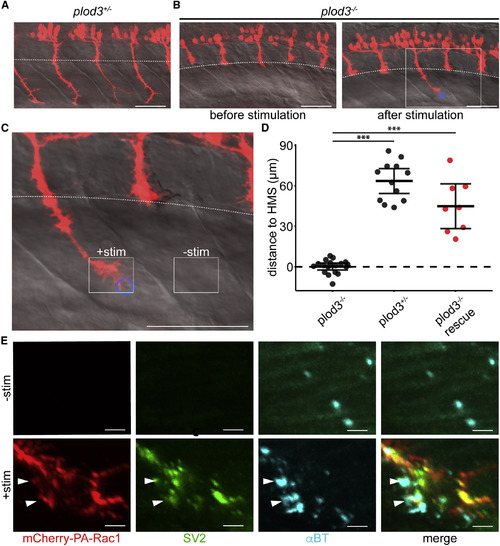
Optogenetic Stimulation of plod3−/− Zebrafish CaP Neurons Rescues Their Axon Guidance Defect, Allowing Juxtaposition of Pre- and Post-synaptic Machinery within the Ventral Myotome (A) PA-Rac1 expression (red) in spinal motor neurons of plod3+/− zebrafish at 28 hpf (scale bar, 50 μm). (B) Left: an age-matched plod3−/− mutant sibling prior to stimulation fails to extend CaP axons into the ventral myotome past the horizontal myoseptum (dashed white line). Right: In plod3−/− fish, a single PA-Rac1+ CaP axon extended into the ventral myotome after illumination, while unilluminated axons remain arrested at the horizontal myoseptum (blue circle, region of illumination; scale bar, 50 μm). (C) Enlarged image of plod3−/− CaP axon following stimulation (solid white box in B; scale bar, 50 μm). (D) Illumination of PA-Rac1+ CaP axons in plod3−/− mutant fish induced growth significantly farther past the horizontal myoseptum than unilluminated axons. There was no significant difference in the distance grown past the horizontal myoseptum in illuminated plod3−/− fish compared with plod+/− fish (FDR adjusted, difference of least square means from mixed linear model, n = 8 axons, one axon per fish, ∗∗∗p < 0.001, mean and 95% CIs shown). (E) Immunohistochemistry for mCherry (red, left), SV2 (green, middle left), and αBT (cyan, middle right) showing colocalization of pre- and post-synaptic markers (merge, right) in the ventral myotome of the stimulated axon (bottom), but not in the unstimulated axon (top; scale bar, 5 μm). Stimulated and unstimulated regions correspond to solid white boxes in (C). See also Video S4. |
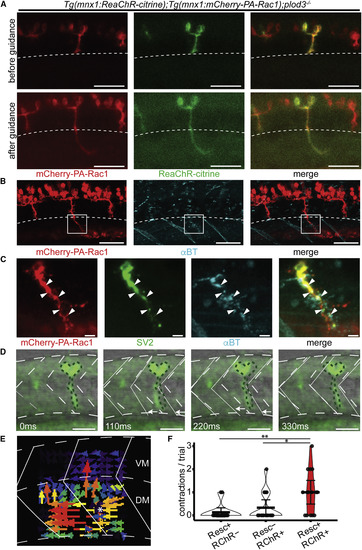
Functional Restoration of Synaptic Connectivity with Ventral Myotome Following Rescue of plod3−/− Zebrafish CaP Axons (A) Before (top) and after (bottom) PA-Rac1 optogenetic-mediated rescue of plod3−/− mutant zebrafish expressing both mCherry-PA-Rac1 (red, left) and ReaChR-citrine (green, middle) transgenes (merge right, scale bar, 50 μm). Only the rescued axon extends into the dorsal myotome, past the horizontal myoseptum (dashed white line). See also Video S5. (B) Immunohistochemistry for mCherry (red, left) and αBT (cyan, middle) illustrates that only the rescued axon extends past the horizontal myoseptum (merge, right; scale bar, 50 μm). Note that red-channel fluorescence ventral to the indicated region of interest (ROI) is from nonspecific accumulation of secondary antibody in the yolk sac. (C) Immunohistochemistry for mCherry (red, left), SV2 (green, middle left), and αBT (cyan, middle right), showed significant colocalization of pre- and post-synaptic markers (merge, right; n = 3 fish, Costes p value > 0.95) in the ventral myotome of the stimulated axon (solid white box in B; scale bar, 5 μm). (D) Time series of ventral myofibril contractions following ReaChR stimulation of a rescued CaP axon. The dotted green lines show the initial position of the axon. The white arrows show the movement of the somatic boundaries (white lines) in the ventral, but not dorsal, myotome compared with time 0 (gray dashed lines; scale bar, 50 μm) (E) Vector fields representing the motion of the zebrafish body wall following ReaChR stimulation of a rescued CaP axon, computed via particle image velocimetry using optical flow analysis of bright field time series images. Color-coded arrows represent the direction and magnitude of optical flow; the point of vector field convergence indicates the initial focus of contraction and is marked by a white asterisk. For the majority of elicited motor responses, the contraction occurred specifically in the somite innervated by the rescued axon (15/17 contractions, see also Videos S6 and S7). (F) Optogenetic depolarization of rescued plod3−/− axons via activation of ReaChR channelrhodopsin (Resc+ RChR+) resulted in significantly more contractions of ventral myofibrils in the targeted somite compared with ReaChR activation of a neighboring axon that had not been rescued (Resc− RChR+) or illumination of the rescued axon stimulated with wavelengths of light outside of the ReaChR activation spectrum (Resc+ RChR−). (Pairwise comparison of estimated marginal means from a Poisson general linear model, n = 3 fish, 5 trials per condition, ∗p < 0.05, ∗∗p < 0.01, mean and 95% CIs shown; see also Video S6). |
Reprinted from Developmental Cell, 53, Harris, J.M., Wang, A.Y., Boulanger-Weill, J., Santoriello, C., Foianini, S., Lichtman, J.W., Zon, L.I., Arlotta, P., Long-Range Optogenetic Control of Axon Guidance Overcomes Developmental Boundaries and Defects, 577-588.e7, Copyright (2020) with permission from Elsevier. Full text @ Dev. Cell