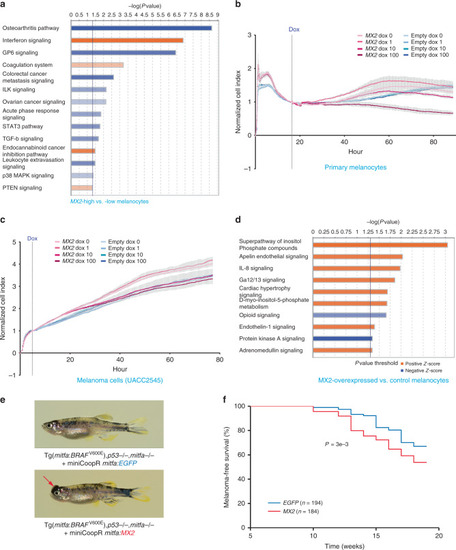
a Ingenuity Pathway Analysis of differentially expressed genes from MX2-high vs. MX2-low melanocytes from 106 individuals. 252 differentially expressed genes (FDR < 1% and >2-fold change) between MX2-high and MX2-low melanocytes (top and bottom quantile based on MX2 levels; n = 28 each) from 106 individuals were used as input for the analysis. Enrichment P-values are based on a two-sided Fisher’s exact test with no multiple-testing correction applied. (B-C) Cell growth and movement of human primary melanocytes C23 (b) or melanoma cell line UACC2545 (c) infected with an inducible lentiviral construct of MX2 cDNA or Empty pINDUCER20 vector were measured on xCELLigence system. Cell Index values were normalized relative to those at the time of doxycycline addition (dotted vertical line: Dox). The amount of doxycycline (dox) is shown in ng/ml and color-coded. Mean Normalized Cell Index (colored dots) and SD (gray vertical lines) are plotted (n = 3). A representative set of three biological replicates is shown. d Ingenuity Pathway Analysis of differentially expressed genes from RNA sequencing of MX2 overexpressed vs. control melanocytes from 3 individuals. 158 differentially expressed genes (FDR < 10%) between MX2-overexpressing (100 ng/ml doxycycline) vs. control (no doxycycline) melanocytes using 3 biological replicates for 3 individuals were used as input for the analysis. Significantly enriched canonical pathways (P < 0.05 and |Z-score| >1) are color-coded for the direction of effect relative to MX2-high melanocytes (a) or MX2-overexpressing melanocytes (d). Enrichment P-values are based on a two-sided Fisher’s exact test with no multiple-testing correction applied. A weaker to stronger shade of each color represent the relative magnitude of Z-scores: Positive Z-score between 1 and 2.646 and negative Z-score between −1 and −3.464 (a) or positive between 1 and 1.134 and negative between −1.342 and −2.236 (d), where lightest red is closer to 1 and lightest blue is closer to −1. (e) Representative pictures of adult fish from GFP or MX2 group. Pictures were taken at week 10 post-injection. f Melanoma-free survival curves of a zebrafish melanoma model43 (Tg(mitfa:BRAFV600E), p53−/−, mitfa−/−). The fish were injected at the one cell stage with either miniCoopR mitfa:MX2 or miniCoopR mitfa:EGFP and monitored weekly for melanoma formation. The percentage of melanoma-free fish was combined from three independent experiments and plotted. Log-rank test was used. Source data are provided as a Source Data file.
Acknowledgments
This image is the copyrighted work of the attributed author or publisher, and
ZFIN has permission only to display this image to its users.
Additional permissions should be obtained from the applicable author or publisher of the image.
Full text @ Nat. Commun.
Your Input Welcome
Thank you for submitting comments. Your input has been emailed to ZFIN curators who may contact you if
additional information is required.
Oops. Something went wrong. Please try again later.