FIGURE SUMMARY
Title

Structure of TBC1D23 N-terminus reveals a novel role for rhodanese domain

Authors
Liu, D., Yang, F., Liu, Z., Wang, J., Huang, W., Meng, W., Billadeau, D.D., Sun, Q., Mo, X., Jia, D.
Source
Full text @ PLoS Biol.

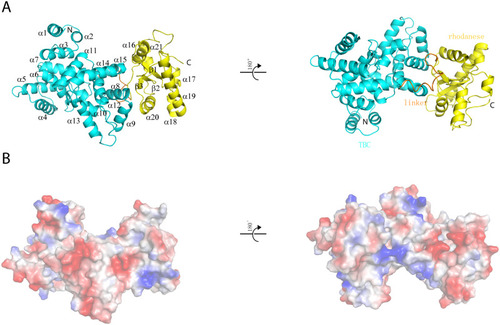
Crystal structure of D23<sup>N</sup>.

(A) Ribbon diagrams of D23N, shown in two orientations rotated 180° with respect to each other. Cyan: TBC domain; gold: linker; yellow: rhodanese domain. (B) Electrostatic surface potential map of D23N, shown in two orientations rotated 180° with respect to each other. Blue: positive; red: negative; white: neutral. The molecules are in the same orientations as those above them in (A). D23N, N-terminus of TBC1D23; TBC, Tre2-Bub2-Cdc16.

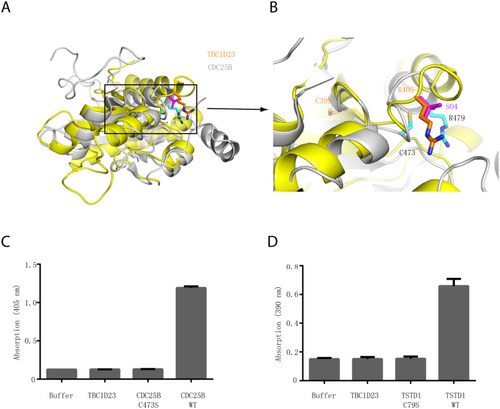
The rhodanese domain of TBC1D23 is unlikely to possess phosphatase or sulfurtransferase activity.

(A) Structural comparison of the crystal structures of TBC1D23 rhodanese domain (yellow) and of CDC25B (gray) (PDB ID: 1qbo). (B) Comparison of the activity site of CDC25B and the corresponding region of TBC1D23. Two essential residues (C473 and R479) from the catalytic CX5R motif of CDC25B are shown and labeled with black font. The corresponding residues (C399 and R405) in TBC1D23 are labeled in gold font. The SO42+ found in the catalytic site of CDC25B is colored in magenta. (C) The phosphatase activity of CDC25B WT, C473S, and TBC1D23 (aa1–460). pNPP was utilized as substrates. The reaction was carried out at 25 °C, and absorbance at 405 nm was monitored. Data are from three replicate experiments (mean ± S.D.), and the numerical data are included in S1 Data. (D) The sulfurtransferase activity of TSTD1 WT, C79S, and TBC1D23 (aa1–460). (E) H2S formed by the reaction of thiosulfate and GSH was determined in the lead sulfide assay, and absorbance at 390 nm was monitored. Data are from three replicate experiments (mean ± S.D.), and the numerical data are included in S1 Data. aa, amino acid; GSH, glutathione; PDB, Protein Data Bank; pNPP, disodium 4-nitrophenyl phosphate; TSTD1, thiosulfate sulfurtransferase like domain containing 1; WT, wild type.

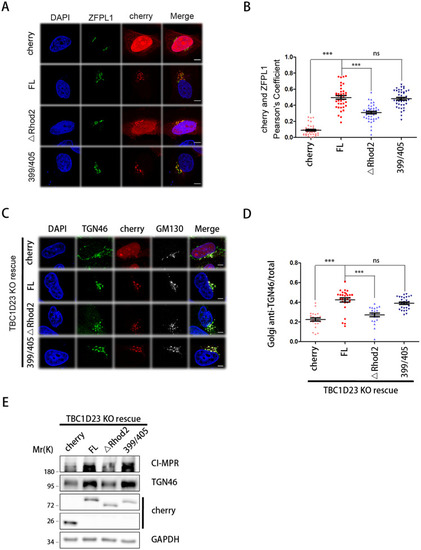
The rhodanese domain, but not residues 399/405, is required for the subcellular localization and functions of TBC1D23.

(A) HeLa cells were transfected with mCherry or mCherry-TBC1D23 FL (“FL”), ΔRhod2 (deleting aa331–460), or C399S/R405A (399/405) and then fixed and labeled with anti-ZFPL1 (Golgi marker, green) antibody. Scale bar: 10 μm. (B) Quantitation of mCherry colocalization with ZFPL1 in cells as treated in (A). Each dot represents Pearson’s correlation coefficients from one cell. P values were calculated using one-way ANOVA, post hoc Tukey’s test. ***P < 0.001. Experiments were triplicated, and the numerical data are included in S1 Data. (C) TBC1D23-KO HeLa cells were transfected with mCherry or FL, ΔRhod2, or 399/405 and then fixed and labeled with anti-TGN46 (green) and GM130 (Golgi marker, white) antibodies. TGN46 is recycled between endosomes and Golgi in a TBC1D23-dependent manner. Scale bar: 10 μm. (D) Quantitation of Golgi-localized TGN46 over its total amount in cells treated as in (C). Each dot represents results from one cell. P values were calculated using one-way ANOVA, post hoc Tukey’s test. ***P < 0.001. Experiments were triplicated, and the numerical data are included in S1 Data. (E) Immunoblot of whole-cell extracts showing the total protein level of CI-MPR and TGN46 in cells treated in (C). aa, amino acid; CI-MPR, cation-independent mannose-6-phosphate receptor; FL, full-length; GAPDH, glyceraldehyde 3-phosophate dehydrogenase; KO, knockout; ns, not significant; TGN, trans-Golgi network; ZFPL1, zinc finger protein like 1.

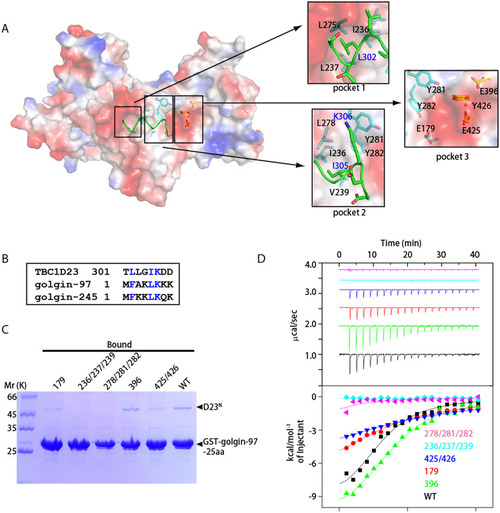
Both TBC and rhodanese domains of TBC1D23 interact with golgin-97/245.

(A) Surface representation of one D23N monomer (molecule 1), with a fragment from symmetry-related D23N molecule shown as sticks (molecule 2, green). Molecule 1 is shown in the identical orientation to that in Fig 1B. Critical residues involved in dimerization are highlighted on the right, with residues from molecule 1 and 2 labeled in black and blue fonts, respectively. (B) Sequence alignment between residues from D23N-linker, N-terminus of golgin-97 and of golgin-245. Blue color indicates same or similar type of aa. (C) GST pull-down assays performed with GST-golgin-97-25aa and purified D23N WT, E179K (“179”), L278A/Y281A/Y282A (“278/281/282”), I236A/I237A/V239A (“236/237/239”), E396K (“396”), or E425K/Y426A (“425/426”). After incubation with soluble protein(s), the resin was extensively washed. The resin-bound proteins were then subjected to SDS-PAGE and Coomassie Blue staining. (D) ITC experiments for the binding of golgin-97-25aa peptide with D23N WT, E179K (“179”), L278A/Y281A/Y282A (“278/281/282”), I236A/I237A/V239A (“236/237/239”), E396K (“396”), or E425K/Y426A (“425/426”). Top and bottom panels show raw and integrated heat from injections, respectively. The solid curves in the bottom panel represent a fit of the integrated data to a single-site binding model. Experiments were triplicated, and the numerical data are included in S1 Data. aa, amino acid; D23N, N-terminus of TBC1D23; GST, glutathione S-transferase; ITC, isothermal titration calorimetry; TBC, Tre2-Bub2-Cdc16; WT, wild type.

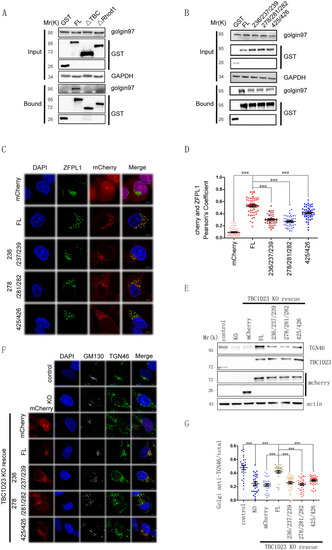
Mutations that weaken golgin-97/245-binding impair subcellular localization and functions of TBC1D23.

(A) GST pull-down analyses of HEK 293T cells transfected with vectors expressing GST, GST-TBC1D23-FL (“FL”), GST-TBC1D23-ΔTBC (deleting aa1–330), or GST-TBC1D23-ΔRhod1 (deleting aa331–513). Cell lysates were precipitated with glutathione-Sepharose beads and probed with anti-GST, golgin-97, or GAPDH (control) antibodies. (B) GST pull-down analyses of HEK 293T cells transfected with vectors expressing GST, GST-TBC1D23-FL (“FL”), TBC1D23-L278A/Y281A/Y282A (“278/281/282”), TBC1D23-I236A/I237A/V239A (“236/237/239”), or TBC1D23-E425K/Y426A (“425/426”). Cell lysates were precipitated with glutathione-Sepharose beads and probed with anti-GST, golgin-97, or GAPDH (control) antibodies. (C) HeLa cells were transfected with mCherry, or mCherry-TBC1D23 FL (“FL”), TBC1D23-L278A/Y281A/Y282A (“278/281/282”), TBC1D23-I236A/I237A/V239A (“236/237/239”), or TBC1D23-E425K/Y426A (“425/426”) and then fixed and labeled with anti-ZFPL1 (blue) antibody. Scale bar: 10 μm. (D) Quantitation of mCherry colocalization with ZFPL1 (Golgi marker) in cells as treated in (C). Each dot represents Pearson’s correlation coefficients from one cell. P values were calculated using one-way ANOVA, post hoc Tukey’s test. ***P < 0.001. Experiments were triplicated, and the numerical data are included in S1 Data. (E) Immunoblot of whole-cell extracts of parental HeLa Cells (control), TBC1D23 KO cells (“KO”), TBC1D23 KO cells transfected with vectors expressing mCherry, mCherry-TBC1D23-FL (“FL”), TBC1D23-L278A/Y281A/Y282A (“278/281/282”), TBC1D23-I236A/I237A/V239A (“236/237/239”), or TBC1D23-E425K/Y426A (“425/426”). Cell lysates were probed with anti-cherry, TBC1D23, TGN46, or actin (control) antibodies. (F) Confocal immunofluorescence of TBC1D23 KO HeLa cells transfected with vectors expressing mCherry, mCherry-TBC1D23-FL (“FL”), TBC1D23-L278A/Y281A/Y282A (“278/281/282”), TBC1D23-I236A/I237A/V239A (“236/237/239”), or TBC1D23-E425K/Y426A (“425/426”). The cells were fixed and labeled with anti-TGN46 (green) and GM130 (white) antibodies. Scale bar: 10 μm. (G) Quantitation of Golgi-localized TGN46 over its total amount in cells treated as in (F). Each dot represents results from one cell. P values were calculated using one-way ANOVA, post hoc Tukey’s test. ***P < 0.001. Experiments were triplicated, and the numerical data are included in S1 Data. aa, amino acid; FL, full-length; GAPDH, glyceraldehyde 3-phosphate dehydrogenase; GST, glutathione S-transferase; HEK, human embryonic kidney; KO, knockout; TBC, Tre2-Bub2-Cdc16; TGN, trans-Golgi network; ZFPL1, zinc finger protein like 1.

Disruption of TBC1D23-golgin-97/245 interaction impairs neuronal growth and brain development in zebrafish.

(A) HuC (elavl3) spatial expression in zebrafish at 48 hpf, determined by in situ hybridization. MO: MO injection; MO+ FL: MO and human FL TBC1D23 mRNA co-injection; MO+278/281/282: MO and human TBC1D23 L278A/Y281A/Y282A mutant mRNA co-injection; MO+236/237/239: MO and human TBC1D23 I236A/I237A/V239A mutant mRNA co-injection; MO+399/405: MO and human TBC1D23 C399S/R405A mutant mRNA co-injection. All injections are performed at the one-cell stage Top, lateral view; bottom, dorsal view. (B) The relative size of zebrafish midbrain. The size of the midbrain was measured from lateral view, and 5 to 10 embryos from each group were used for comparison. Data are presented as mean ± S.E.M. ****P < 0.0001. P values were calculated using one-way ANOVA, Tukey’s multiple-comparisons test. Experiments were triplicated, and the numerical data are included in S1 Data. (C) Relative transcription level of HuC at 48 hpf by semiquantitative RT-PCR analysis. Mean ± S.E.M. *P < 0.05. P values were calculated using one-way ANOVA, Tukey’s multiple-comparisons test. Experiments were triplicated, and the numerical data are included in S1 Data. (D) HuC (green) expression in Tg[HuC: GFP] transgenic zebrafish at 48 hpf, determined by immunofluorescence. Top, lateral view; bottom, dorsal view. (E) Morphology of CaP axons from embryos at 48 hpf that were injected MO and/or different mRNA. All injections are performed at the one-cell stage of the Tg[hb9: GFP]ml2 transgenic zebrafish embryos. Arrows indicate abnormal branches. Lateral views and enlarged views are shown. (F) Statistical results of the branch number of CaP axons in embryos treated as in (E). For each group, approximately 45 axons from nine Tg[hb9: GFP]ml2 transgenic zebrafish embryos are scored. Mean ± S.E.M. ****P < 0.0001,*P < 0.05. P values were calculated using one-way ANOVA, Tukey’s multiple-comparisons test. Experiments were triplicated, and the numerical data are included in S1 Data. FL, full-length; hpf, hours post fertilization; MO, morpholino oligonucleotide; ns, not significant; RT-PCR, reverse transcription PCR; WT, wild type.

Acknowledgments
This image is the copyrighted work of the attributed author or publisher, and ZFIN has permission only to display this image to its users. Additional permissions should be obtained from the applicable author or publisher of the image. Full text @ PLoS Biol.