
- Title
-
Cardiac function modulates endocardial cell dynamics to shape the cardiac outflow tract
- Authors
- Sidhwani, P., Leerberg, D.M., Boezio, G.L.M., Capasso, T.L., Yang, H., Chi, N.C., Roman, B.L., Stainier, D.Y.R., Yelon, D.
- Source
- Full text @ Development
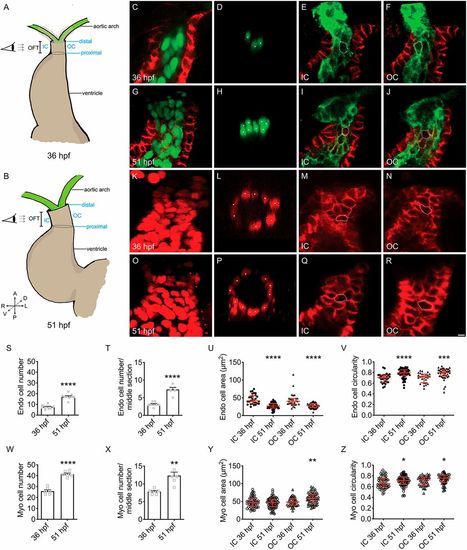
Endocardial and myocardial cells accumulate as the OFT develops. (A,B) Cartoons illustrate frontal views of the wild-type heart at 36 (A) and 51 hpf (B) and highlight the IC, OC, and proximal and distal boundaries of the OFT. Eye and arrows indicate the angle of imaging used to visualize the OFT. (C,D,G,H,S,T) Immunofluorescence indicates localization of Alcama (red), which outlines myocardial cells, and expression of Tg(fli1a:negfp) (green), which labels endocardial nuclei. Lateral slices (C,G) and middle cross-sections (D,H) through the OFT demonstrate that the number of OFT endocardial cells increases between 36 (C,D) and 51 hpf (G,H), as quantified in S and T (n=12, 9 embryos analyzed in total, over the course of 3 experimental replicates (N=3); see Materials and Methods for details regarding replicates). ****P<0.0001, significant differences from 36 hpf, Student's t-test. White dots indicate GFP+ nuclei in D and H. (E,F,I,J,U,V) Immunofluorescence marks Alcama (red) and expression of Tg(kdrl:HsHRAS-mCherry) (green), which outlines endocardial cells. Partial reconstructions of the IC (E,I) and OC (F,J) endocardial walls demonstrate that endocardial cells get smaller (U) and rounder (V) over time [n=7, 9 embryos; 29 (IC 36 hpf), 59 (IC 51 hpf), 27 (OC 36 hpf), 43 (OC 51 hpf) cells; N=3; ***P<0.001, ****P<0.0001; significant differences from same wall at 36 hpf, Mann–Whitney U-test]. White dotted outlines mark representative cells. (K,L,O,P,W,X) Three-dimensional reconstructions (K,O) and middle cross-sections (L,P) of the OFT, with immunofluorescence marking expression of Tg(myl7:H2A-mCherry), which labels myocardial nuclei, indicating an increase in myocardial cell number between 36 (K,L) and 51 hpf (O,P), as quantified in W and X (n=6, 6; N=1; **P<0.01, ****P<0.0001; significant differences from 36 hpf, Student's t-test). White dots indicate mCherry+ nuclei in L and P. (M,N,Q,R,Y,Z) Partial reconstructions of the OFT myocardial walls at 36 (M,N) and 51 hpf (Q,R), marked by immunofluorescence for Alcama, indicate trends toward a more circular shape of OFT myocardial cells (Z) and enlargement of OC cells (Y) over time [n=8, 8 embryos; 57 (IC 36 hpf), 79 (IC 51 hpf), 45 (OC 36 hpf), 64 (OC 51 hpf) cells; N=2; *P<0.05, **P<0.01; significant differences from same wall at 36 hpf, Mann–Whitney U-test]. White dotted outlines mark representative cells. (S,T,W,X) Bar graphs indicate mean+s.e.m. (U,V,Y,Z) Red lines represent median and interquartile range. Scale bar: 5 μm. |
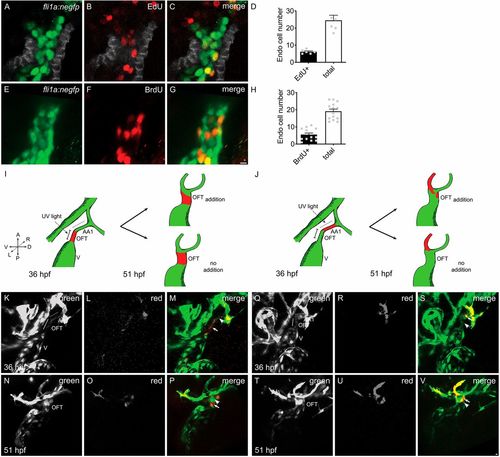
Endocardial proliferation and endothelial addition accompany OFT endocardial growth. (A-D) Lateral slices through the OFT at 51 hpf (A-C) show incorporation of EdU (red) into the Tg(fli1a:negfp)-labeled (green) endocardium between 36 and 51 hpf, with the myocardium marked by immunofluorescence for Alcama (gray). Quantification (D) indicates an OFT endocardial proliferation index (PI) of 25.8±1.2% during this period of OFT expansion (n=6; N=1). (E-H) Lateral views of three-dimensional reconstructions at 51 hpf (E-G) show incorporation of BrdU (red) into the Tg(fli1a:negfp)-labeled (green) endocardium between 36 and 51 hpf. Quantification (H) indicates an OFT endocardial PI of 28.9±4.2% (n=14; N=2). Data are mean+s.e.m. (I,J) Cartoons illustrate the schemes for photoconversion experiments designed to assess the contribution of external sources (I) or endothelial cells from the AA1 (J) to the OFT endocardium. V, ventricle. (K-P) Three-dimensional reconstructions depict expression of Tg(kdrl:dendra), which drives the green-to-red photoconvertible protein Dendra in all endothelial cells. Photoconversion of the OFT endocardium (K-M) at 36 hpf was followed by detection of green cells, which had not been labeled by photoconversion, in the OFT endocardium at 51 hpf (N-P), indicating the contribution of cells from external sources to the OFT endocardium during this time period (n=3; N=2). Arrowheads indicate examples of cells that were not labeled by photoconversion (green only) and arrows indicate examples of cells that were labeled by photoconversion (red and green). (Q-V) Photoconversion of a portion of AA1 endothelium (red) at 36 hpf (Q-S) was followed by detection of labeled cells in the OFT at 51 hpf (T-V) (n=5; N=2). Scale bars: 5 μm. |
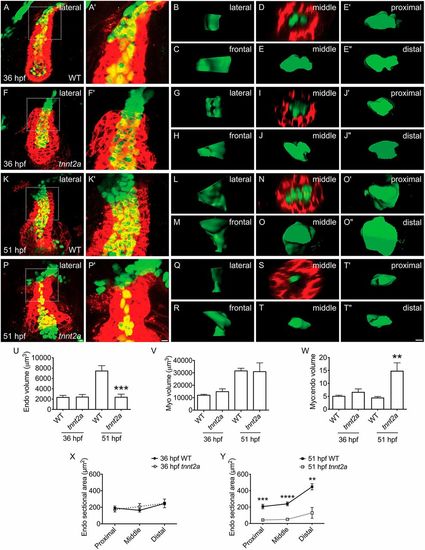
Cardiac function promotes OFT growth. (A,F,K,P,U,V,W) Lateral views of three-dimensional reconstructions comparing the OFT and ventricle in wild-type (WT) (A,K) and tnnt2a mutant embryos (F,P), labeled by immunofluorescence for Alcama (red) and Tg(fli1a:negfp) (green). As Alcama is found in the basolateral boundaries of myocardial cells, the endocardium is visible through the myocardial layer. Closer views of the OFT (A′,F′,K′,P′) demonstrate relatively similar morphology in WT (A′) and tnnt2a mutant (F′) embryos at 36 hpf (n=5, 4; N=2). See also Movies 1 and 3. However, by 51 hpf, whereas the WT OFT endocardial and myocardial volumes (K′) have expanded significantly (P<0.0005, Student's t-test), the OFT endocardium in tnnt2a mutants (P′) has failed to expand, as quantified in U and V, resulting in a significantly higher ratio of myocardial to endocardial volume in tnnt2a mutants by 51 hpf (W) (n=7, 6; N=2; **P<0.01, ***P<0.001, difference from WT at same stage, Student's t-test). See also Movies 2 and 4. (B,C,G,H,L,M,Q,R) Lateral (B,G,L,Q) and frontal (C,H,M,R) views of smoothed OFT endocardial surfaces generated from three-dimensional reconstructions of cytoplasmic GFP localization in Tg(kdrl:grcfp) embryos (Fig. S3) display relatively similar OFT morphologies in WT (B,C) and tnnt2a mutants (G,H) at 36 hpf and the different OFT morphologies in WT (L,M) and tnnt2a mutants (Q,R) at 51 hpf. Lateral and frontal surfaces are oriented with their proximal end at the bottom. Of note, the lateral side of the WT OFT at 36 hpf (B) appears to transition into the frontal side at 51 hpf (M), suggesting that the OFT rotates 90° during this time. (D,E,I,J,N,O,S,T,X,Y) Middle cross-sections through the OFTs shown in A′, F′, K′, P′ indicate that the OFT endocardium collapses in tnnt2a mutants between 36 (I) and 51 hpf (S), in contrast to its broadening in WT (D,N). These contrasts are also evident in comparisons between middle (E,J,O,T), proximal (E′,J′,O′,T′) and distal (E″,J″,O″,T″) cross-sections through the smoothed surfaces of the OFT endocardium in Tg(kdrl:grcfp)-expressing embryos (Fig. S3), as quantified in X and Y (n=6, 4 for 36 hpf; 5, 5 for 51 hpf; N=2; **P<0.01, ***P<0.001, ****P<0.0001; differences from WT at same positions, Student's t-test). The broadening of the WT endocardium between 36 and 51 hpf is especially striking at its distal end (E″,O″,X,Y). Proximal, middle and distal sections are oriented with the OC of the OFT to the left. (U-Y) Bar graphs and line graphs indicate mean±s.e.m. Scale bars: 5 μm. |
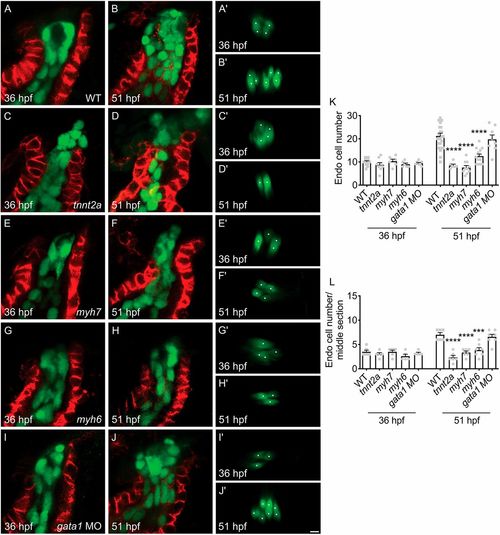
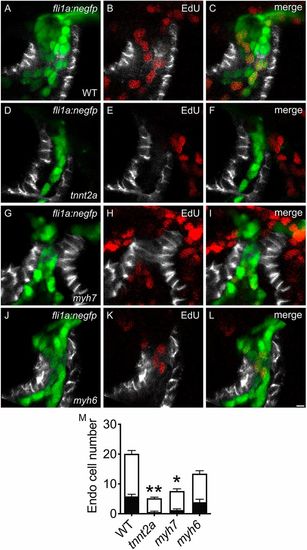
Cardiac function promotes accrual of endocardial cells in the OFT. (A-L) Lateral slices (A-J) and middle cross-sections (A′-J′) through the OFT (as in Fig. 1C,D) illustrate the number of OFT endocardial cells at 36 (A,C,E,G,I) and 51 hpf (B,D,F,H,J). As shown in Fig. 1S,T, the number of endocardial cells in the wild-type (WT) OFT increases between 36 (A,A′) and 51 hpf (B,B′), as quantified in (K,L). In contrast, in tnnt2a mutant embryos, OFT endocardial cells fail to accrue between 36 (C,C′) and 51 hpf (D,D′). A similar deficiency in OFT endocardial accrual is found in myh7 mutant embryos (E,E′,F,F′), and myh6 mutant embryos (G,G′,H,H′) also exhibit a reduction in OFT endocardial cell number by 51 hpf. However, gata1 morphants (I,I′,J,J′) exhibit a normal number of OFT endocardial cells. (K,L) Bar graphs indicate mean±s.e.m. [n=15 (WT), 8 (tnnt2a), 6 (myh7), 6 (myh6), 7 (gata1 MO) for 36 hpf; 24 (WT), 6 (tnnt2a), 10 (myh7), 13 (myh6), 8 (gata1 MO) for 51 hpf; N=2; ***P<0.001, ****P<0.0001; differences from WT at same stage, Student's t-test]. Scale bar: 5 μm. |
OFT endocardial proliferation depends upon functional inputs. (A-L) Lateral slices through the OFT at 51 hpf (as in Fig. 2A-C) illustrate EdU incorporation between 36 and 51 hpf in wild-type (WT) (A-C), tnnt2a mutant (D-F), myh7 mutant (G-I) and myh6 mutant (J-L) embryos. (M) Black and white bars in graph represent mean number of EdU+ and EdU− endocardial cells, respectively (mean±s.e.m.). EdU incorporation is significantly reduced in tnnt2a mutants (PI=10.2±4.3%) and myh7 mutants (PI=15.6±4.9%), but not in myh6 mutants (PI=27.8±6.3%), compared with WT (PI=29.6±3.7%) [n=17 (WT), 10 (tnnt2a), 13 (myh7), 7 (myh6); N=2; *P<0.05, **P<0.01; differences in PI compared with WT, Student's t-test]. Scale bar: 5 μm. |
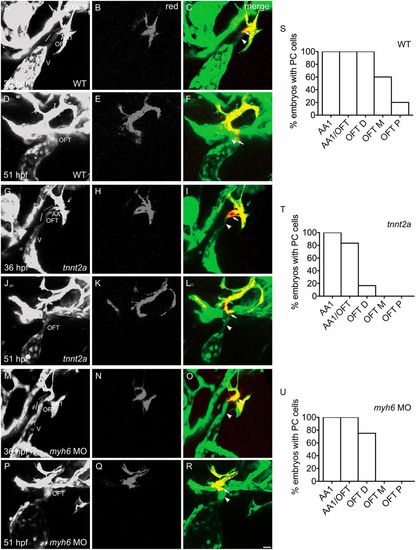
Cardiac function promotes addition of endothelial cells from the aortic arches to the OFT endocardium. (A-U) Three-dimensional reconstructions depict the photoconversion of a portion of AA1 endothelium at 36 hpf (as in Fig. 2Q-S) in wild-type (WT) (A-C), tnnt2a mutants (G-I) or myh6 morphants (M-O). By 51 hpf, labeled cells are routinely detected (as in Fig. 2T-V) in the WT OFT, as quantified in S (n=5; N=2). See also Movie 5. In contrast, in tnnt2a mutants (J-L) and myh6 morphants (P-R) at 51 hpf, labeled cells are found less often in the distal OFT (OFT D) and are entirely absent from the middle and proximal OFT (OFT M and OFT P, respectively), compared with WT (D-F), as quantified in T and U [n=6 (tnnt2a), 5 (myh6 MO); N=2]. See also Movies 6 and 7. Arrowheads indicate examples of cells that were not labeled by photoconversion (green only) and arrows indicate examples of cells that were labeled by photoconversion (red and green). (S-U) Bar graphs (as in Fig. S1) indicate the percentage of embryos in which labeling of AA1 endothelium at 36 hpf resulted in detection of photoconverted (PC) cells in AA1, at the junction of AA1 and the OFT (AA1/OFT), OFT D, OFT M or OFT P at 51 hpf. V, ventricle. Scale bar: 20 μm. |
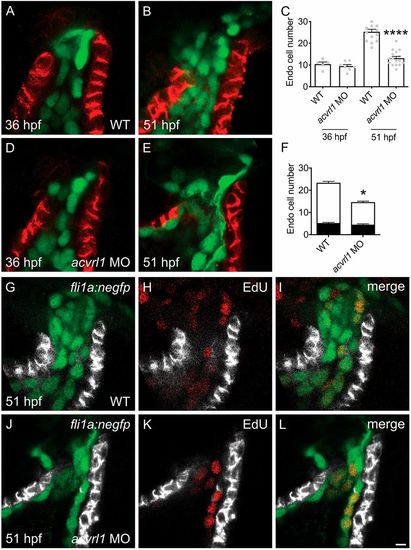
Acvrl1 promotes OFT endocardial expansion, but is not required for endocardial proliferation. (A-E) Lateral slices (A,B,D,E) through the OFT (as in Fig. 1C) illustrate the number of OFT endocardial cells at 36 (A,D) and 51 (B,E) hpf. At 36 hpf, wild-type (WT) (A) and acvrl1 morphant (D) embryos have similar numbers of OFT endocardial cells (n=5, 8; N=2). However, by 51 hpf, acvrl1 morphants (E) have significantly fewer OFT endocardial cells compared with WT (B) (n=14, 16; N=2). Bar graph (C) indicates mean±s.e.m. (****P<0.0001, difference from WT, Student's t-test). (F-L) Lateral slices (G-L) through the OFT at 51 hpf (as in Fig. 2A-C) illustrate EdU incorporation between 36 and 51 hpf in WT (G-I) and acvrl1 morphant (J-L) embryos. Black and white bars in graph (F) represent mean number of EdU+ and EdU− endocardial cells, respectively (mean±s.e.m). The reduced number of OFT endocardial cells in acvrl1 morphants is not a consequence of defective proliferation, as the number of EdU+ cells in the acvrl1 morphant OFT (J-L) is similar to that in WT (G-I), resulting in an acvrl1 morphant PI of 29.1±2.7%, which is significantly higher than that of WT (PI=21.5±1.9%) (n=8, 7; N=2; *P<0.05, difference in PI from WT, Student's t-test). Scale bar: 5 μm. |
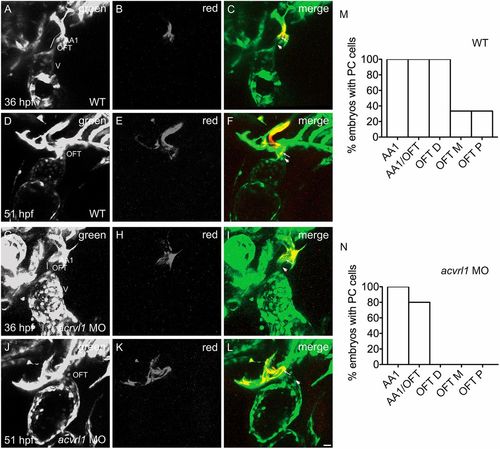
Acvrl1 promotes OFT growth by regulating endothelial addition. (A-N) Three-dimensional reconstructions depict the photoconversion of a portion of AA1 endothelium at 36 hpf (as in Fig. 2Q-S) in wild-type (WT) embryos (A-C) or acvrl1 morphants (G-I). By 51 hpf, labeled cells are routinely detected (as in Fig. 2T-V) in the WT OFT (D-F), as quantified in M (n=3; N=2). However, in acvrl1 morphants, labeled AA1 endothelial cells fail to accrete to the OFT by 51 hpf (J-L) (n=5; N=2). See also Movie 8. Arrowheads indicate examples of cells that were not labeled by photoconversion (green only) and arrows indicate examples of cells that were labeled by photoconversion (red and green). (M,N) Bar graphs (as in Fig. S1) indicate the percentage of embryos in which photoconversion of AA1 endothelium at 36 hpf resulted in detection of photoconverted (PC) cells in AA1, at the junction of AA1 and the OFT (AA1/OFT), the distal OFT (OFT D), the middle OFT (OFT M) or the proximal OFT (OFT P) at 51 hpf. Scale bar: 20 μm. |