- Title
-
Bidirectional crosstalk between Hypoxia-Inducible Factor and glucocorticoid signalling in zebrafish larvae
- Authors
- Marchi, D., Santhakumar, K., Markham, E., Li, N., Storbeck, K.H., Krone, N., Cunliffe, V.T., van Eeden, F.J.M.
- Source
- Full text @ PLoS Genet.
|
arnt1 and arnt2 have partially overlapping functions and synergistically contribute to HIF signalling. A. Schematic representation of zebrafish hif1β (arnt1) gene. Exons are shown as black boxes, whereas introns as lines. The red arrowhead shows the position of a +7 bp insertion in exon 5 (encoding the bHLH DNA binding domain). In the arnt1 wt and mutant sequence. CRISPR target site: bold. Protospacer-adjacent-motif (PAM) sequence: red. B-B’. Magnified picture of a representative 5 dpf vhl-/- larva compared to 5dpf arnt1-/-;vhl-/- (C-C’). Among the 120 GFP+ embryos derived from arnt1+/-;vhl+/-(phd3:eGFP) x arnt1-/-;vhl+/-(phd3:eGFP), 15 larvae were characterized by the absence of pericardial oedema, no ectopic extra vasculature at the level of the tail, no bright liver and a reduced brightness in the rest of the body (black and white arrowheads). Genotyping post phenotypic analysis on sorted larvae confirmed genotype-phenotype correlation. Fluorescence, exposure = 2 seconds. Scale bar 200 μm. D-G. Representative picture of phenotypic analysis performed on DMSO and BME [30 μM] treated 5 dpf larvae, derived from arnt1+/-;vhl+/-(phd3:eGFP) x arnt1-/-;vhl+/-(phd3:eGFP) (n = 540). All the genotype combinations observed are represented in the figure. Among the 405 GFP+ larvae, all the 25 arnt1-/-;vhl-/- showed the aforementioned partially rescued vhl phenotype (D). Fluorescence, exposure = 2 seconds. Scale bar 500 μm. H-J. Representative pictures of 5 dpf CRISPANT mutants created by redundantly targeting arnt2 gene via co-injection of 4x gRNAs in arnt1+/-;vhl+/-(phd3:eGFP) x arnt1-/-; vhl+/-(phd3:eGFP) derived embryos (n = 300). Uninjected embryos were used as control (n = 120). White asterisks: head, liver and tail ragions. Fluorescence, exposure = 991,4 ms. Scale bar 500 μm. K. Statistical analysis performed on mean grey values quantification (at the level of the head, liver and tail), after phenotypic analysis on 5 dpf arnt2 4x gRNAs injected and uninjected larvae. vhl-/- uninjected n = 8 larvae: head 93.1 ± 2.33 (mean ± s.e.m); liver 99.65 ± 3.49 (mean ± s.e.m); tail 29.58 ± 0.73 (mean ± s.e.m). arnt1-/-;vhl-/- uninjected n = 10 larvae: head 56.49 ± 3.36 (mean ± s.e.m); liver 24,7 ± 2.36 (mean ± s.e.m); tail 12.39 ± 0,75 (mean ± s.e.m). vhl-/- injected n = 12 larvae: head 43.69 ± 3.25 (mean ± s.e.m); liver 45.54 ± 4.57 (mean ± s.e.m); tail 16.09 ± 1.37 (mean ± s.e.m). arnt1-/-;vhl-/- injected n = 11 larvae: head 24.66 ± 1.63 (mean ± s.e.m); liver 13.88 ± 0.66 (mean ± s.e.m); tail 5.16 ± 0.33 (mean ± s.e.m). Ordinary One-way ANOVA followed by Sidak’s multiple comparison test (*P < 0.05; **P < 0.01; ***P <0.001; ****P < 0.0001). PHENOTYPE:
|
|
HIF signalling inversely correlate with GC transcriptional activity and cortisol biosynthesis. A. Schematic view of RTqPCR analysis on fkbp5 expression performed on the vhl+/-(phd3:eGFP) and the arnt1+/-(phd3:eGFP) mutant lines at 5 dpf:. Upregulated (in vhl-/-) HIF signalling repressed Gr activity, whereas arnt1 loss of function derepressed it. Statistical analysis was performed on ΔΔCt values, whereas data are shown as fold change values for RTqPCR analysed samples; ordinary Two-way ANOVA followed by Dunnett’s multiple comparison test (*P < 0.05; **P < 0.01; ***P <0.001; ****P < 0.0001). B-C’. Representative pictures of WISH performed on DMSO and BME [30 μM] treated arnt1 mutant line, at 5 dpf, using pomca as probe. arnt1 wt DMSO treated (n = 30/30 larvae) showed normal pomca expression; arnt1 wt BME treated (n = 29/30 larvae) showed downregulated pomca expression. In contrast, arnt1-/- DMSO treated (n = 28/30) and arnt1-/- BME treated (n = 30/30) larvae showed downregulated pomca expression. Chi-square test (****P < 0.0001). Scale bar 50 μm. D-E’. Representative pictures of WISH performed on DMSO and BME [30 μM] treated vhl mutant line, at 5 dpf, using pomca as probe. DMSO treated vhl siblings (n = 26/28) showed normal pomca expression; BME treated vhl siblings (n = 28/30) showed downregulated pomca expression. In contrast, vhl-/- DMSO (n = 28/29) and BME (n = 28/28) treated larvae showed downregulated pomca expression. Chi-square test (****P < 0.0001). Scale bar 50 μm. F-F’. Steroid quantification results showed a significantly reduced cortisol concentration (P value <0;0028) in vhl mutants (92.7 fg/larva, in triplicate), compared to vhl siblings (321 fg/larva, in triplicate) at 5 dpf (F). Moreover, a significantly increased cortisol concentration (P value <0;0001) was measured in arnt1 mutants (487.5 fg/larva, in triplicate), compared to arnt1 wild-types (325 fg/larva, in triplicate) at 5 dpf (F’); unpaired t-test (**P < 0.01; ***P <0.001). G. DMSO: Speculative scheme of how the putative HIF-GC crosstalk occurs in wildtypes and how it is affected both in arnt1-/- and in vhl-/- larvae at 5 dpf. In wildtype scenario HIF signalling helps the GC-GR negative feedback to protect the body from an uncontrolled stress response. In particular, we speculate that HIF transcriptional activity is able to inhibit pomca expression when cortisol levels arise over a certain threshold in order to maintain both HIF and GC basal levels. However, in arnt1-/- scenario, the HIF-mediated negative feedback is compromised by the lack of a functional Arnt1. This triggers an initial uncontrolled pomca expression, which increases cortisol levels and subsequently downregulate pomca expression itself. Vice versa, in vhl-/- scenario, the HIF-mediated negative feedback can exert a stronger inhibition of pomca due to the presence of upregulated HIF signalling. This results both in downregulated cortisol levels and in a suppressed GR responsiveness. However, the presence of alternative mechanisms cannot be completely excluded (i.e HIF might interact more directly with GC/GR to impair its function). Finally, the combination high cortisol/low pomca is very rare and this combination may change over the course of development. G. BME: Speculative scheme of how the putative HIF-GC crosstalk occurs in wildtypes and how it is affected both in arnt1-/- and in vhl-/- larvae at 5 dpf, after BME[30μM] treatment. In all the cases, because of betamethasone acts downstream of the HPI axis, by binding directly to Gr, it is able to upregulate glucocorticoid target genes expression. Consequently, since GC are able to stimulate HIF signalling, as expected, we observed an increase phd3:eGFP-related brightness both in wildtypes and in vhl-/-. However, the fact that we did not observed any HIF upregulation both in arnt1-/- and in arnt1-/-;vhl-/-, highlighted the fact that the BME-induced HIF signalling activation is an Arnt1 dependent mechanism. |
|
gr mutation partially rescues vhl phenotype. A. Schematic representation of zebrafish gr (nr3c1) gene. Exons are shown as boxes, introns as lines. The red arrowhead shows the position of a -11 bp deletion in exon 3 (encoding the DNA binding domain). gr wt and mutant sequence. CRISPR target site: bold. PAM sequence: red. B-C’. Representative pictures of WISH performed on DMSO and BME [30 μM] treated gr mutant line, at 5 dpf, using pomca as probe. Scale bar 100 μm. gr siblings DMSO treated (n = 30/30 larvae) showed normal expression; gr siblings (n = 29/30 larvae) showed downregulated pomca expression after BME treatment. Both DMSO treated (n = 30/30) and BME treated (n = 30/30) gr-/- larvae showed upregulated pomca expression. D. RTqPCR analysis performed on gr wt (n = 10; 3 repeats) and gr-/- (n = 10; 3 repeats) larvae at 5 dpf, using fkbp5 as probe. Statistical analysis was performed on ΔΔCt values, whereas data are shown as fold change values. Ordinary Two-way ANOVA followed by Dunnett’s multiple comparison test (****P < 0.0001). E-G. Magnified picture of representative gr-/-; vhl-/- larvae compared to arnt1-/-;vhl-/- and vhl-/- larvae. Both double mutants are characterized by the absence of pericardial oedema, no ectopic extra vasculature at the level of the tail, no bright liver and a reduced brightness in the rest of the body (white and black arrowheads), compared to vhl-/- larvae. Fluorescence, exposure = 2 seconds. Scale bar 200 μm. H. RTqPCR analysis performed both on HIF and GC target genes expression carried out on gr-/-; vhl-/- and sibling at 5 dpf, (n = 10 larvae, per group, in triplicate) compared to arnt1-/-;vhl-/- larvae and siblings, at 5dpd (n = 10 larvae, per group, in triplicate). Both vegfab and egln3 are HIF target genes, whereas fkbp5 is a GC target gene. Statistical analysis was performed on ΔΔCt values, whereas data are shown as fold change values, Ordinary Two-way ANOVA followed by Dunnett’s multiple comparison test. I-L. Representative picture of phenotypic analysis performed on DMSO and BME [30 μM] treated gr+/-; vhl+/-(phd3:eGFP) incross-derived 5 dpf larvae (n = 600). All the genotype combinations observed are represented in the figure. Among the 450 GFP+ larvae analysed, 28 showed a partially rescued vhl phenotype which resembled the arnt1’s one. Three experimental repeats. In all panels: *P < 0.05; **P < 0.01; ***P <0.001; ****P < 0.0001. Fluorescence, exposure = 2 seconds. Scale bar 500 μm. |
|
gr loss of function effect is stronger when HIF-signalling is moderately upregulated. A-E. Representative picture of the main differences between vhl-/-, arnt1-/-;vhl-/-, gr-/-;vhl-/- and triple gr-/-;arnt1-/-;vhl-/- larvae at 5 dpf. Among the 488 phd3:eGFP expressing larvae analysed, 7 larvae were characterized by the absence of pericardial oedema (black arrowheads, left), no ectopic extra vasculature at the level of the tail (black arrowheads, right), no visible phd3:eGFP HIF reporter in the liver (white arrowheads, left) and even more reduced levels of this marker in the head and in the rest of the body (white arrowheads, right). Genotypic analysis allowed to confirm the presence of a genotype-phenotype correlation in 5 out 7 samples and to prove that they were triple mutants. Fluorescence, exposure = 2 seconds. Scale bar 200 μm. F-I. Representative pictures of WISH performed on gr+/-; vhl+/- incross derived larvae, at 5 dpf, using pomca as probe. Of note, gr-/-;vhl-/- showed upregulated pomca expression (20/20 larvae), as observed in gr-/- (20/20 larvae); vhl mutants showed downregulated pomca expression (20/20 larvae), whereas wildtypes showed normal pomca expression (19/20). Chi-square test (****P < 0.0001). Scale bar 50 μm. |
|
BME treatment is able to upregulate HIF signalling in vhl-/-. A-B’. Representative pictures of WISH performed on DMSO (A-B) and BME [30 μM] (A’-B’) treated vhl+/- incross derived larvae, at 5 dpf, using ldha as probe. DMSO treated vhl siblings showed basal ldha expression (34/35 larvae), which showed to be upregulated after BME treatment (33/35 larvae). On the other hand, DMSO treated vhl-/- showed upregulated ldha expression (32/35 larvae), which was further upregulated after BME treatment (34/35 larvae). (black arrowhead: head and liver) Chi-square test (****P < 0.0001). Scale bar 200 μm. C-D’. Representative pictures of WISH performed on DMSO (C-D) and BME [30 μM] (C’-D’) treated vhl+/- incross derived larvae, at 5 dpf, using phd3 (egln3) as probe. As expected, vhl siblings DMSO treated (n = 30/30 larvae) showed basal phd3 expression, which was mildly increased after BME treatment (n = 27/30 larvae). Vhl-/- DMSO treated (n = 28/30 larvae) showed upregulated phd3 expression, which was further increased after BME treatment (n = 26/30 larvae). (black arrowhead: head and liver) Chi-square test (****P < 0.0001). Scale bar 200 μm |
|
Both Gr and Mr are directly required in the HIF signalling pathway. A-F. Representative pictures of 5 dpf CRISPANT mutants created by redundantly targeting nr3c2 (mr) gene via co-injection of 4x gRNAs in gr+/-;vhl+/-(phd3:eGFP) x gr-/-; vhl+/-(phd3:eGFP) derived embryos (n = 344). Uninjected embryos were used as control (n = 170). Fluorescence, exposure = 991,4 ms. Scale bar 500 μm. G. Statistical analysis performed on mean grey value quantification (at the level of the head, liver and tail), after phenotypic analysis, on 5 dpf mr 4x gRNAs injected and uninjected larvae. vhl-/- uninjected n = 17 larvae: head 48.28 ± 2.99 (mean ± s.e.m); liver 46.47 ± 3.55 (mean ± s.e.m); tail 16.15 ± 1.06 (mean ± s.e.m). gr-/-;vhl-/- uninjected n = 8 larvae: head 35.48 ± 2.03 (mean ± s.e.m); liver 23.56 ± 1.72 (mean ± s.e.m); tail 10.98 ± 0.75 (mean ± s.e.m). vhl-/- injected n = 15 larvae: head 24.62 ± 0.97 (mean ± s.e.m); liver 20.67 ± 1.1 (mean ± s.e.m); tail 8.57 ± 0.39 (mean ± s.e.m). gr-/-;vhl-/- injected n = 16 larvae: head 18.33 ± 0.46 (mean ± s.e.m); liver 10.71 ± 0.56 (mean ± s.e.m); tail 6.07 ± 0.26 (mean ± s.e.m); ordinary One-way ANOVA followed by Sidak’s multiple comparison test. PHENOTYPE:
|
|
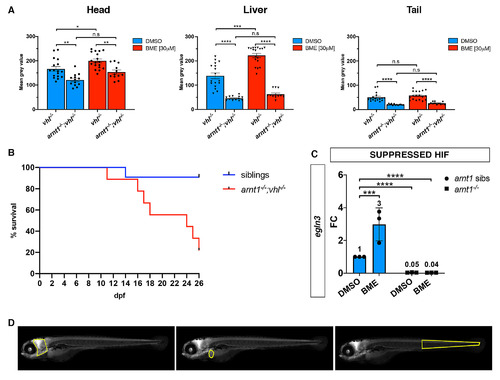
arnt1-/-; vhl-/- larvae showed a reduced phd3:eGFP brightness and a partially rescued vhl phenotype. A. Statistical analysis performed on mean gray value quantification (at the level of the head, liver and tail), after phenotypic analysis on 5dpf DMSO and BME [30μM] treated arnt1+/-;vhl+/-(phd3:eGFP) x arnt1-/-; vhl+/-(phd3:eGFP) derived larvae (n = 540). vhl-/- DMSO treated n = 17 larvae: head 166.67 ± 9.63 (mean ± s.e.m); liver 138.61 ± 12.05 (mean ± s.e.m); tail 50.31 ± 4.51 (mean ± s.e.m). arnt1-/-;vhl-/- DMSO treated n = 13 larvae: head 121.05 ± 6.99 (mean ± s.e.m); liver 49.61 ± 3.88 (mean ± s.e.m); tail 21.75 ± 1.12 (mean ± s.e.m). vhl-/- BME treated n = 18 larvae: head 199.88 ± 7.71 (mean ± s.e.m); liver 222.57 ± 8.72 (mean ± s.e.m); tail 57.57 ± 4.11 (mean ± s.e.m). arnt1-/-;vhl-/- BME treated n = 12 larvae: head 153.71 ± 8.66 (mean ± s.e.m); liver 62.58 ± 5.16 (mean ± s.e.m); tail 25.82 ± 1.54 (mean ± s.e.m). Ordinary One-way ANOVA followed by Sidak’s multiple comparison test (*P < 0.05; **P < 0.01; ***P <0.001; ****P < 0.0001). B. Kaplan-Meier survival curves of the zebrafish arnt1+/-; vhl+/-(phd3:eGFP) genotype analysed in this study. Time is shown in days. Siblings n = 30; arnt1-/-; vhl-/-(phd3:eGFP) n = 8. The Log-rank (Mantel-Cox) test was used for statistical analysis. arnt1-/-; vhl-/-(phd3:eGFP) vs. siblings: **P < 0.0027. C. RTqPCR analysis performed on arnt1 siblings (n = 10; 3 repeats) and arnt1-/- (n = 10; 3 repeats) larvae at 5 dpf, using egln3 as probe. Statistical analysis was performed on ΔΔCt values, whereas data are shown as fold change values. Ordinary Two-way ANOVA followed by Dunnett’s multiple comparison test (***P <0.001;****P < 0.0001). D. Representative picture of head, liver and tail areas selected in each larva to quantify the phd3:eGFP-related brightness via mean grey value quantification (Fiji, ImageJ software). |
|
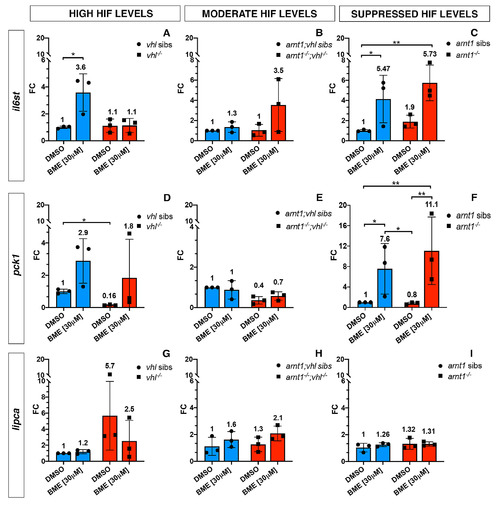
GC target genes expression in the presence of high, moderately upregulated and suppressed HIF signalling pathway. Schematic view of RTqPCR analysis on il6st, pck1 and lipca (GC target genes) expression performed on the following mutant lines: vhl+/-(phd3:eGFP), arnt1+/-;vhl+/-(phd3:eGFP) and arnt1+/-(phd3:eGFP). Statistical analysis performed on ΔΔCt values; data are shown as fold change values for RTqPCR analysed samples; ordinary Two-way ANOVA followed by Dunnett’s multiple comparison test (*P < 0.05; **P < 0.01; ***P <0.001; ****P < 0.0001). |
|
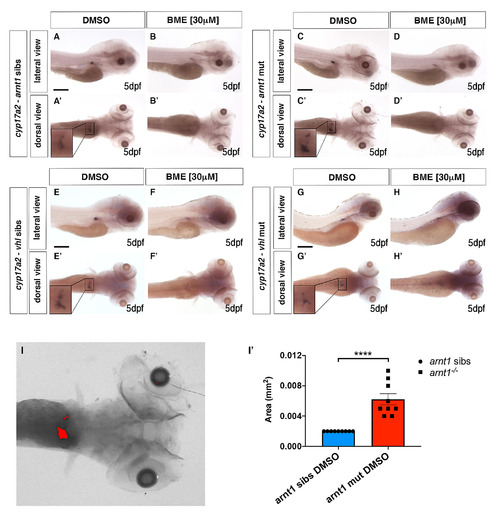
gr-/-; vhl-/- larvae showed a reduced phd3:eGFP brightness and a partially rescued Vhl phenotype. A-D’. Representative pictures of WISH performed on DMSO and BME [30 μM] treated arnt1 mutant line, at 5 dpf, using cyp17a2 as probe. A-A’) arnt1 wt DMSO treated larvae (n = 26/28) showed normal cyp17a2 expression, whereas 2/28 larvae showed a weaker one; B-B’) arnt1 wt BME treated larvae (n = 28/30) showed downregulated cyp17a2 expression, whereas 2/30 larvae showed a normal one. C-C’) In contrast, arnt1-/- DMSO treated larvae (n = 24/28) showed upregulated cyp17a2 expression, whereas 4/28 larvae showed a weaker one. D-D’) arnt1-/- BME treated larvae (n = 25/29) showed downregulated cyp17a2 expression, whereas 4/29, showed a normal one. Chi-square test (****P < 0.0001). Scale bar 200 μm. E-H’. Representative pictures of WISH performed on DMSO and BME [30 μM] treated vhl mutant line, at 5 dpf, using cyp17a2 as probe. E-E’) DMSO treated vhl siblings (n = 18/21) showed normal cyp17a2 expression, whereas 3/21 larvae showed a weaker one; F-F’) BME treated vhl siblings (n = 28/30) showed downregulated cyp17a2 expression, whereas 2/30 larvae showed a normal one. G-G’) On the other hand, vhl-/- DMSO treated larvae (n = 27/28) showed weak cyp17a2 expression, whereas 1/28 larvae showed a normal one. H-H’) vhl-/- BME treated larvae (n = 30/30) showed downregulated cyp17a2 expression. Chi-square test (****P < 0.0001). Scale bar 200 μm. I-I’. Representative picture of the colour threshold area calculation method (ImageJ software’s tool) used to quantify the area occupied by the cyp17a2 WISH staining both in arnt1 siblings (n = 9) and arnt1-/- (n = 9). I’. unpaired t-test (****P <0.0001). |
|
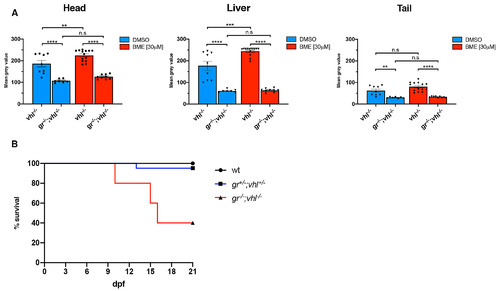
gr-/-; vhl-/- larvae showed a reduced phd3:eGFP brightness and a partially rescued vhl phenotype. A. Statistical analysis performed on mean gray value quantification (at the level of the head, liver and tail), after phenotypic analysis on 5dpf DMSO and BME [30μM] treated gr+/-;vhl+/-(phd3:eGFP) x gr-/-; vhl+/-(phd3:eGFP) derived larvae (n = 600). vhl-/- DMSO treated n = 9 larvae: head 186 ± 15.12 (mean ± s.e.m); liver 177.01 ± 20.85 (mean ± s.e.m); tail 62.34 ± 7.27 (mean ± s.e.m). gr-/-;vhl-/- DMSO treated n = 7 larvae: head 106.96 ± 3.21 (mean ± s.e.m); liver 60.75 ± 2.56 (mean ± s.e.m); tail 30.67 ± 1.27 (mean ± s.e.m). vhl-/- BME treated n = 14 larvae: head 224.32 ± 6.83 (mean ± s.e.m); liver 244.07 ± 5.31 (mean ± s.e.m); tail 80.51 ± 5.49 (mean ± s.e.m). gr-/-;vhl-/- BME treated n = 9 larvae: head 125.85 ± 3.6 (mean ± s.e.m); liver 63.56 ± 2.91 (mean ± s.e.m); tail 33.67 ± 1.02 (mean ± s.e.m). Ordinary One-way ANOVA followed by Sidak’s multiple comparison test (*P < 0.05; **P < 0.01; ***P <0.001; ****P < 0.0001). B. Kaplan-Meier survival curves of the zebrafish gr+/-; vhl+/-(phd3:eGFP) genotype analysed in this study. Time is shown in days. Wild-types n = 20; gr+/-; vhl+/- n = 20; gr-/-; vhl-/-(phd3:eGFP) n = 5. The Log-rank (Mantel-Cox) test was used for statistical analysis. gr-/-; vhl-/-(phd3:eGFP) vs. gr+/-; vhl+/-, ****P < 0.0001; gr-/-; vhl-/-(phd3:eGFP) vs. wt, ****P < 0.0001 |
|
gr-/-;arnt1-/-;vhl-/- showed an even more reduced phd3:eGFP brightness. Statistical analysis performed on mean gray values quantification (at the level of the head, liver and tail), after phenotypic analysis on 5dpf gr+/-;arnt1+/-vhl+/-(phd3:eGFP) incross-derived GFP+ larvae (n = 488). vhl-/- n = 5 larvae: head 125.82 ± 13.05 (mean ± s.e.m); liver 98.52 ± 3.8 (mean ± s.e.m); tail 37.43 ± 2.45 (mean ± s.e.m). gr-/-;arnt1-/-;vhl-/- n = 5 larvae: head 40.24 ± 2.46 (mean ± s.e.m); liver 26.07 ± 1.31 (mean ± s.e.m); tail 11.22 ± 0.47 (mean ± s.e.m); unpaired t-test (***P = 0.0002; ****P < 0.0001). |
|
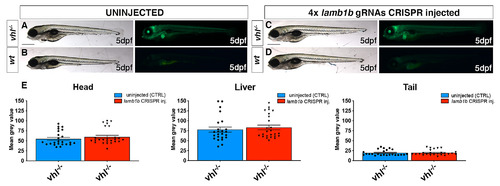
CRISPR/Cas9 injection per se does not affect HIF signalling. A-D. Representative pictures of 5 dpf CRISPANT mutants created by redundantly targeting lamb1b gene via co-injection of 4x gRNAs in vhl+/-(phd3:eGFP) incross-derived embryos (n = 400). Uninjected embryos were used as control (n = 470). Fluorescence, exposure = 991,4 ms. Scale bar 500 μm. E. Statistical analysis performed on mean grey values quantification (at the level of the head, liver and tail), after phenotypic analysis on 5 dpf lamb1b 4x gRNAs injected and uninjected vhl+/-(phd3:eGFP) incross-derived larvae. vhl-/- uninjected n = 24 larvae: head 54.83 ± 3.68 (mean ± s.e.m); liver 77.86 ± 6.46 (mean ± s.e.m); tail 19.56 ± 1.43 (mean ± s.e.m). vhl-/- injected n = 25 larvae: head 59.74 ± 4.05 (mean ± s.e.m); liver 83.23 ± 5.92 (mean ± s.e.m); tail 19.9 ± 1.38 (mean ± s.e.m); unpaired t-test (all panels: *P < 0.05; **P < 0.01; ***P <0.001; ****P < 0.0001). |

