
- Title
-
Fgf-driven Tbx protein activities directly induce myf5 and myod to initiate zebrafish myogenesis
- Authors
- Osborn, D.P.S., Li, K., Cutty, S.J., Nelson, A.C., Wardle, F.C., Hinits, Y., Hughes, S.M.
- Source
- Full text @ Development
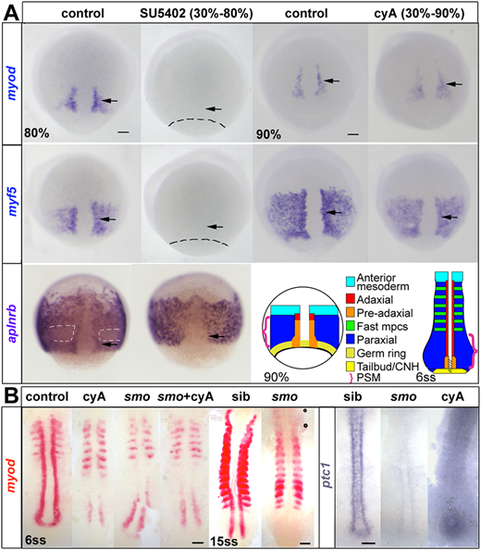
ISH for myod and myf5 in control untreated, cyA-treated (100 µM) and SU5402-treated (60 μM) wild-type or mutant embryos, shown in dorsal view, anterior to top. (A) Adaxial (arrows) and paraxial myod and myf5 mRNAs are lost upon SU5402 treatment from 30% to 80 or 90% epiboly (dashes indicate approximate position of the germ ring) but are unaffected by cyA treatment. The anterior mesoderm marker aplnrb is normally downregulated in paraxial presomitic cells expressing myf5 (white dashes) and upregulated in adaxial cells (arrows). Both changes were absent after SU5402 treatment. Schematics illustrate the location of equivalent cell types at two successive stages. CNH, chordoneural hinge (hatched); mpcs, muscle precursor cells; PSM, presomitic mesoderm (brackets). (B) Smob641 mutants retain pre-adaxial myod mRNA at 6ss even after cyA treatment, but lack pre-adaxial myod mRNA at 15ss. ptc1 (ptch2) mRNA downregulation shows that both smo mutation and cyA treatment (shown after longer colour reaction) fully block Hh signalling throughout the axis. Scale bars: 50 µm. EXPRESSION / LABELING:
PHENOTYPE:
|
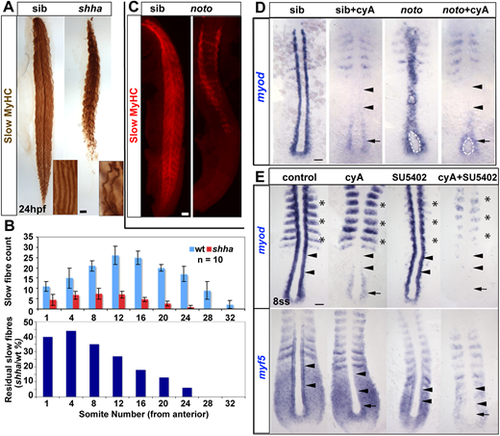
(A) Immunodetection showing slow fibre reduction is greater in tail than trunk in shha mutants. Insets show individual fibres magnified. (B) Quantification of experiment in A. Upper graph shows mean±s.d. (n=10 embryos of each genotype). Lower graph shows the fraction remaining in the mutant. (C) Trunk-specific residual slow muscle in noto mutant. (D) 5ss embryos from a noton1 heterozygote incross treated with cyA at 30% epiboly stage, showing loss of adaxial myod mRNA in anterior presomitic mesoderm (arrowheads), but retention in the most posterior pre-adaxial mesoderm (arrows) flanking the chordoneural hinge (white outline). (E) Exposure to cyA diminishes myf5 and myod mRNAs in adaxial cells in anterior PSM (arrowheads). Exposure to SU5402 (50 µM) at the tailbud stage ablates residual pre-adaxial myod and myf5 mRNAs in cyA-treated 8ss embryos (arrows). Expression of paraxial myod in fast muscle precursors (asterisks) is not affected by cyA but is decreased by SU5402. Scale bars: 50 µm. EXPRESSION / LABELING:
PHENOTYPE:
|
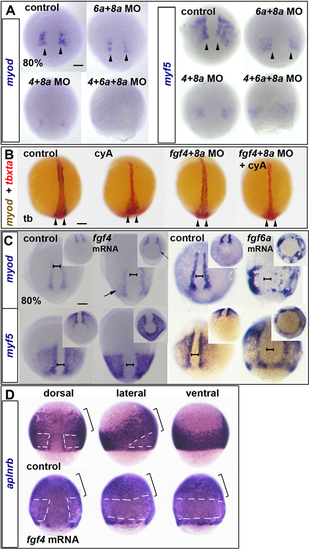
(A-D) ISH for myod and myf5 (A,C) or aplnrb (D) mRNAs at 80% epiboly or tbxta (red) and myod (blue/brown) at the tailbud stage (tb) (B). (A) Reduction of myod and myf5 mRNAs in dual and triple Fgf MO-injected wild-type embryos. Arrowheads indicate nascent adaxial cells. (B) In contrast to 80% epiboly (compare with Fig. S4C), at the tailbud stage, cyA treatment ablates anterior adaxial myod mRNA, but leaves pre-adaxial expression intact (arrowheads). Injection of fgf4+fgf8a MOs ablate residual myod mRNA. (C) fgf4 or fgf6a mRNA injection upregulates myod and myf5 mRNAs around the marginal zone (arrows). Note the widening of the unlabelled dorsal midline region (brackets). Insets show the same embryos viewed from the vegetal pole. (D) fgf4 mRNA injection downregulates aplnrb mRNA around the marginal zone (white dashes) but not anteriorly (brackets) in the dorsalised embryo. Scale bars: 100 µm. EXPRESSION / LABELING:
PHENOTYPE:
|
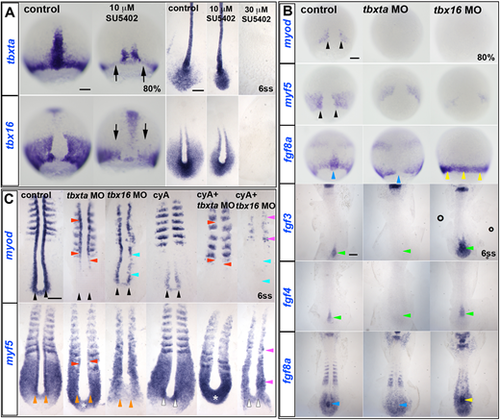
ISH of drug and/or MO-treated embryos. (A) In 10 µM SU5402-treated wild-type embryos, tbxta and tbx16 transcripts are decreased (arrows) at 80% epiboly, but almost normal at 6ss. Both transcripts are absent in 30 µM SU5402-treated embryos at 6ss. (B) Adaxial myod expression (black arrowheads) is completely ablated in tbxta or tbx16 morphants at 80% epiboly, and myf5 expression is greatly decreased (black arrowheads). fgf8a mRNA is ablated in the posterior notochord of tbxta morphants (blue arrowheads), but upregulated in tbx16 morphants around the germ marginal zone at 80% and in the posterior notochord at 6ss (yellow arrowheads). Expression of fgf3 and fgf4 is absent in posterior notochord of tbxta morphants, but enhanced in that location in tbx16 morphants (green arrowheads). (C) At 6ss, pre-adaxial myod expression (black arrowheads) is lost in tbxta morphant tailbud, and diminished in tbx16 morphants. Injection of tbx16 MO, but not tbxta MO, reduces adaxial myf5 mRNA to the level observed in paraxial mesoderm (orange arrowheads), whereas tbxta MO but not tbx16 MO upregulates myf5 mRNA in the posterior tailbud (asterisks). Tbx16 MO abolishes pre-adaxial myf5 mRNA in cyA-treated embryos (white arrowheads). Adaxial myf5 and myod transcripts recover in tbxta morphants, but are ablated by cyA-treatment (red arrowheads). CyA-treatment of tbx16 morphants ablates adaxial myod expression throughout the axis (cyan arrowheads), leaving only residual paraxial myod and myf5 expression (pink arrowheads). Scale bars: 100 µm. EXPRESSION / LABELING:
PHENOTYPE:
|
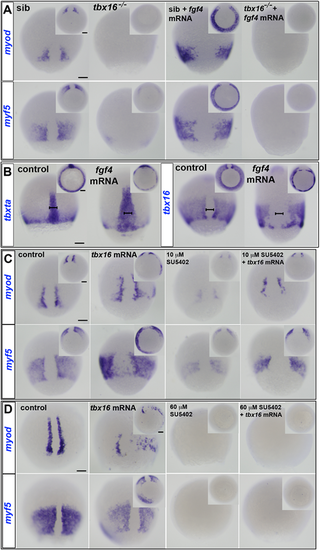
ISH of manipulated embryos at 80% epiboly stage. Dorsal views. Insets show ventral views. (A) myf5 and myod mRNAs flank the dorsal midline in siblings (sib), but are absent or greatly diminished in tbx16−/− mutants. fgf4 mRNA injection widened notochord and induced ectopic myod and myf5 mRNA around the germ marginal zone of siblings, but did not rescue expression in tbx16−/− embryos. (B) tbxta mRNA reveals widened notochord (bars) in wild-type embryos injected with fgf4 mRNA. Both tbxta and tbx16 mRNAs show clumping in the germ ring after overexpression of fgf4. (C,D) ISH at 80% epiboly stage for myf5 and myod mRNAs in wild-type control or tbx16 mRNA-injected embryos treated with SU5402 at 10 µM (C) or 60 µM (D). myf5 and myod mRNAs are ectopically induced in posterior mesoderm by Tbx16 expression, but decreased by administration of 10 µM SU5402 in wild type, and rescued in SU5402-treated embryos by overexpression of tbx16. High dose SU5402 prevents MRF expression, even after tbx16 mRNA injection. Scale bars: 100 µm. |
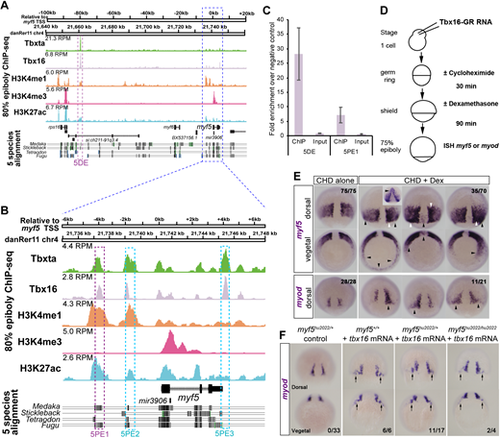
(A,B) ChIP-seq on wild-type embryos at 75-85% epiboly reveals endogenous Tbx16 and Tbxta binding events within 120 kb flanking the myf5 transcriptional start site (TSS). H3K4me3 indicates TSSs. H3K4me1 indicates putative enhancers. H3K27ac indicates active enhancers. Known transcripts with exons (black) and introns (arrowheads) are indicated. Purple and cyan boxes indicate validated and other mentioned Tbx16 binding sites, respectively. (C) ChIP-qPCR validation of Tbx16 peaks on myf5 distal element (5DE) and proximal element 2 (5PE1). Error bars indicate s.e.m. for biological triplicate experiments. (D) Schematic of Tbx16 direct-target assay. (E) Wild-type embryos injected with tbx16-GR mRNA treated with CHD±DEX. CHD alone permits wild-type myf5 expression at 75-80% epiboly, whereas CHD+DEX induced mosaic ectopic myf5 expression with strong (white arrowheads, comparable to wild-type pre-adaxial level) and weak (black arrowheads, comparable to wild-type paraxial level) staining. Numbers indicate the fraction of embryos with the expression pattern(s) shown. Inset shows an unusual induction of myf5 in anterior regions that was not observed with myod. (F) Injection of tbx16 mRNA (200 pg) into embryos from a myf5hu2022/+ heterozygote incross led to ectopic upregulation of myod mRNA in the dorsal germ ring (arrows) irrespective of genotype. Numbers indicate fraction of embryos showing ectopic mRNA/total analysed. Scale bars: 100 µm. |
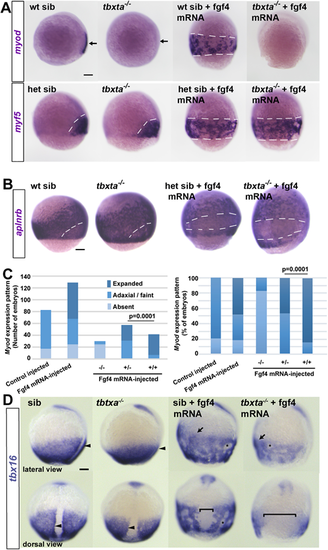
Embryos from a tbxta+/− incross injected with 150 pg fgf4 mRNA or control. (A) Tbtxa−/− mutants lack myod mRNA (arrows) but retain myf5 mRNA in presomitic mesoderm (white dashes). Fgf4 induced myf5 and myod mRNAs throughout the posterior mesoderm in siblings (sib; white dashes), but failed to induce myod mRNA in mutants. (B) Fgf4 suppressed aplnrb mRNA in posterior mesoderm above the germ ring (white dashes) in both tbxta−/− mutants and siblings. In A,B, individually genotyped embryos are shown in lateral view, dorsal to right. (C) Scoring of myod mRNA accumulation in response to Fgf4 in a tbxta+/− incross. Expanded: ventral expansion, generally all around germ ring as in A. Adaxial/faint: either wild-type pattern, or reduced intensity in a small proportion of mutants that was not significantly altered by Fgf4. Left: absolute number of embryos analysed from two experiments to emphasise the lack of induction in mutants (see Table S3). Right: alternative display to highlight the reduced response in heterozygotes compared with wild type (χ2 test). (D) Adaxial upregulation of tbx16 mRNA is lost in tbxta−/− mutants (arrowheads). Fgf4 upregulates tbx16 mRNA throughout ventral posterior mesoderm (arrows) and causes mesodermal cell aggregation (asterisks). tbxta−/− mutants accumulate less tbx16 mRNA than siblings and have less expression on the dorsal side (brackets). Scale bars: 100 µm. |
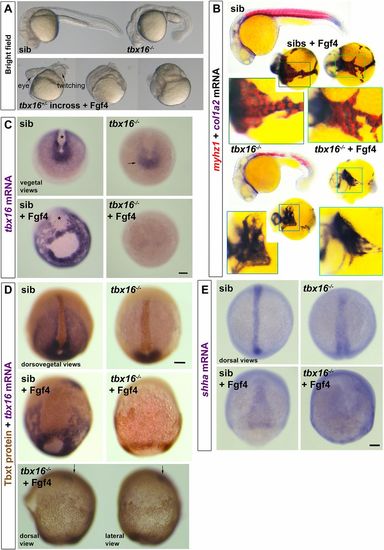
Tbx16 is essential for Fgf4-driven upregulation of tbx16 and suppression of tbxta. Embryos from a tbx16+/− incross injected with 150 pg fgf4 mRNA or control. (A) By 24 hpf, Fgf4-injected embryos have disorganised heads and, although lacking obvious trunk or tail, some contain twitching muscle. (B) ISH for col1a2 for dermomyotome/connective tissue and myhz1 for skeletal muscle revealed muscle in fgf4-injected sibs, but not in tbx16−/− mutants. Boxed areas are magnified to show the alternating pattern of aggregated muscle and connective tissue in Fgf4-injected siblings, but the reduced col1a2 and absent myhz1 mRNA in Fgf4-injected mutants. Note the aggregation of posterior mesoderm cells into strands around the yolk. (C) ISH for tbx16 mRNA in embryos from a tbx16+/− incross at around 90% epiboly. Nonsense-mediated decay of the mutant transcript is apparent (arrow). fgf4 RNA injection increases tbx16 mRNA in paraxial mesoderm, widens dorsal axial notochord domain (asterisks) and causes aggregation of paraxial cells in siblings, but suppresses residual tbx16 transcript in mutants. (D) Immunodetection of Tbxt protein and tbx16 mRNA in Fgf4-injected and control embryos from a tbx16+/− incross. The Fgf4-injected tbx16−/− mutant (bottom) reveals nuclear Tbxt protein in the entire posterior mesoderm. Residual tbx16 mRNA in the prechordal region (arrows) but absence in posterior mesoderm demonstrates the genotype. (E) Widespread upregulation of shha mRNA reveals the notochord-like character of posterior mesoderm in Fgf4-injected tbx16−/− mutant. Scale bars: 100 µm. EXPRESSION / LABELING:
|