
- Title
-
Twist3 is required for dedifferentiation during extraocular muscle regeneration in adult zebrafish
- Authors
- Zhao, Y., Louie, K.W., Tingle, C.F., Sha, C., Heisel, C.J., Unsworth, S.P., Kish, P.E., Kahana, A.
- Source
- Full text @ PLoS One
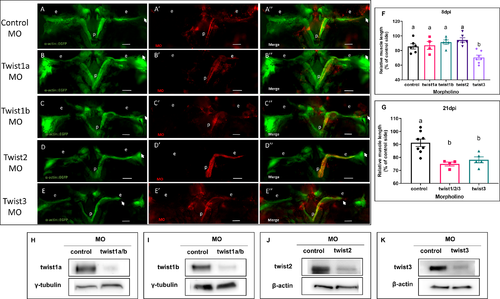
To knock down Twist TFs, lissamine-tagged MOs (red) against twist 1a, 1b, 2, and 3 were microinjected into Tg(α-actin::EGFP) (green) fish muscles 4 h prior to myectomy. (A-E'') MO injected fish were shown. (H-J) Knockdown effect of twist 1a/b, and twist2 MO was validated in embryos by Western blot. (K) Knockdown effect of twist3 MO was validated in EOM by Western blot. (F) The length of regenerating muscle was measured as described; values are averages ±SEM (one-way ANOVA, p<0.05 between group a and b, control:n = 6, twist1a: n = 4, twist1b: n = 5, twist2: n = 6, twist3: n = 7). (G) Twist3 MO inhibits but does not delay EOM regeneration; mixture of all 4 Twist TFs MOs or single control and twist3 MO were microinjected into α-actin-EGFP fish muscles 4 h prior to myectomy. The length of regenerating muscle was measured as described; values are averages ±SEM (one-way ANOVA, p<0.05 between group a and b, control: n = 8, twist1/2/3: n = 4, twist3: n = 5). White arrows marked the growing end of the regenerating muscle. p, pituitary; e, eye; scale bar: 250μm. PHENOTYPE:
|
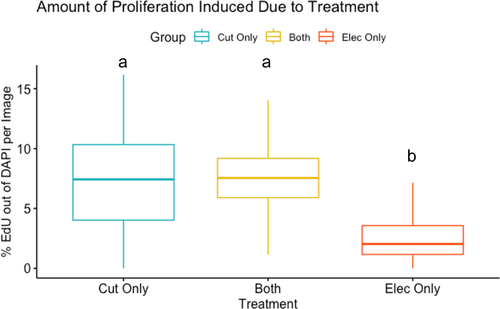
Boxplot of the percentage of proliferating nuclei (EdU) out of all nuclei (DAPI), in three different treatment groups: cut only (blue), both cut and electroporation (yellow), and electroporation only (red). The boxplot displays the minimum, 25th percentile, median, 75th percentile, and maximum for the groups. p<0.001 between two statistic groups a and b by ANOVA. |
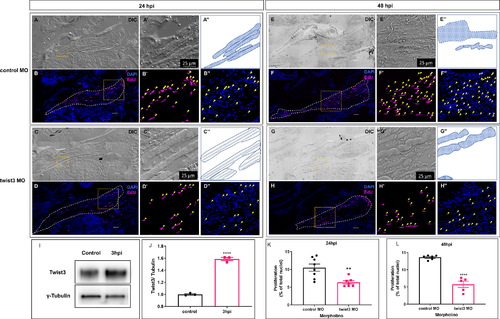
The role of Twist3 in myocyte reprogramming and proliferation at 24 and 48 hpi was assessed by injecting Tg(α-actin::EGFP) fish with twist3 MO. Morphology of myocytes was shown using DIC images (A, C, E, G), highlighted in higher magnification (A’, C’, E’, G’) and illustrated in schematic diagram (A”, C”, E”, G”; solid line: outline of muscle; dash line” approximate outline of muscle; dotted pattern” mesenchyme-like myocytes; long light blue line: myofiber; short vertical strips: Z-band architecture). (B, D, F, H) Proliferating myoblasts were stained by EdU incorporation. EdU: magenta; DAPI: blue; Yellow arrows: positive Edu staining nuclei and corresponding DAPI channel. (I, J) Western blot analysis for Twist3 protein expression during EOM regeneration; values were averages ±SEM (t-test, p<0.0001 between control and 3hpi, n = 3). (K, L) Cell proliferation in injured muscle was significantly less in Twist3 MO injection group compared with control group at both 24 and 48 hpi. (24 hpi, control: n = 8, twist3 MO: n = 7; 48 hpi, control: n = 6, twist3 MO: n = 5) Scale bar: 50 μm, **p<0.01, ****p<0.0001. |
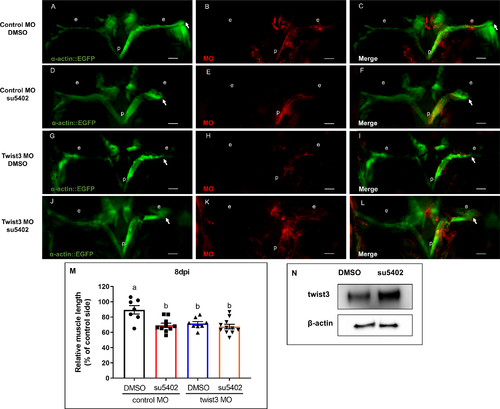
Myectomized Tg(α-actin::EGFP) fish were treated with su5402 (D-F), or injected with twist3 MO (G-I), or treated with su5402 and injected with twist3 MO (J-L) compared with DMSO treatment and control MO injection (A-C). (M) All the experiment groups demonstrated significantly inhibited muscle regeneration, with no additive effect detected by combination of two treatments at 8 dpi. (p, pituitary; e, eye; Scale bar: 250μm, p<0.05 between two statistic groups a and b by ANOVA, control MO/DMSO: n = 7, control MO/su5402: n = 10, twist3 MO/DMSO: n = 8, twist3 MO/su5402: n = 11). PHENOTYPE:
|
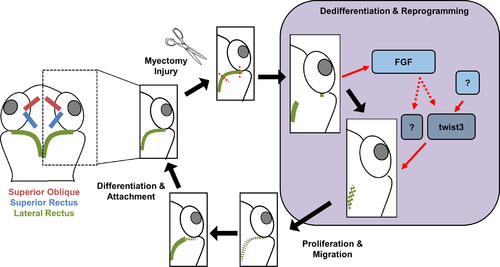
Following myectomy injury, twist3 expression is elevated and promotes myocytes cell reprogramming and dedifferentiation. The known role of Fgf combined with our results (Fig 4) suggest that twist3 shares a common pathway with Fgf. |
|
Western blot of phospho-histone H3 shows twist3 MO injection induced p-histone H3 at 24 and 48 hpf. |
|
Tg(α-actin::EGFP) embryos that were injected with twist 1a/b, 2, or 3 MO at the one- to four-cell state demonstrated EOM formation at 5 dpf from dorsal (B-D), lateral (B'-D'), Ventral (B''-D''), and phenotype (B‴-D‴) compared with control embryos (A-A‴). SO: Superior Oblique, SR: Superior Rectus, LR: Lateral Rectus, IO: Inferior Oblique, IR: Inferior Rectus. Asterisk: undeveloped jaw muscle, red arrow: incorrectly inserted EOM, scale bar: 100μm. PHENOTYPE:
|
|
Tg(α-actin::EGFP) embryos that were injected with twist2 MO at the one- to four-cell state demonstrated EOM formation at 48 or 72 hpf from dorsal (B, D), lateral (B'-D'), and ventral (B''-D'') compared with control embryos (A-A'', C-C''). SO: Superior Oblique, SR: Superior Rectus, LR: Lateral Rectus, IO: Inferior Oblique, IR: Inferior Rectus. Red arrow: incorrectly inserted EOM, scale bar: 100μm. PHENOTYPE:
|