FIGURE SUMMARY
Title

The Requirement of Sox2 for the Spinal Cord Motor Neuron Development of Zebrafish

Authors
Gong, J., Hu, S., Huang, Z., Hu, Y., Wang, X., Zhao, J., Qian, P., Wang, C., Sheng, J., Lu, X., Wei, G., Liu, D.
Source
Full text @ Front. Mol. Neurosci.

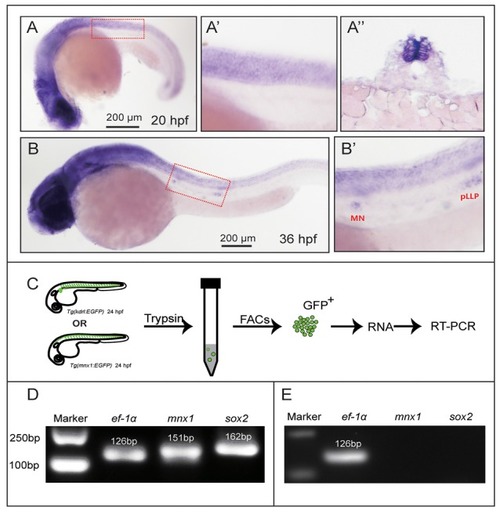
Sex-determining region Y box 2 (Sox2) expression analyses in the spinal cord and motor neurons. (A) At 20 hpf, the in situ hybridization signal of Sox2 is localized in the spinal cord. (A′) The magnified figure of the region squared in dashed line. (A″) The trunk transverse section of the embryos. (B) Sox2 is expressed in the spinal cord and the deposited neuromasts. (B′) The magnified figure of the region squared in dashed line. Scale bar = 200 μm. (C) The procedure of the motor neurons and endothelial cells sorting and RT-PCR. (D) The results of the RT-PCR on Mnx1-GFP sorted cells. Sox2 is expressed in the selected neuron cells from the Tg(Mnx1:EGFP) line. (E) The result of the RT-PCR on Kdrl-EGFP sorted cells. No signals of Sox2 and mnx1 are detected in the GFP-positive cells sorted from the Tg(kdrl:EGFP) line.

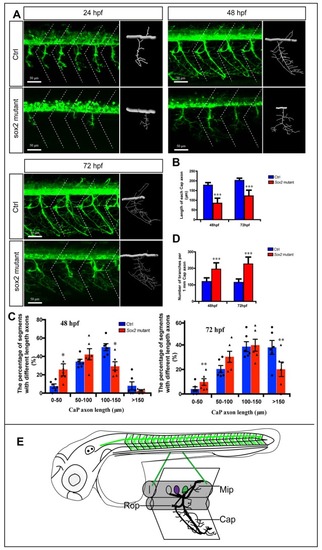
Primary motor neuron morphogenesis defects in the Sox2 knockout zebrafish. (A) Confocal imaging analysis of primary motor neurons in control and Sox2 knockout groups at 24, 48, and 72 hpf. The dotted diagonal line marked the boundary of the myosepta. Scale bar = 50 μm. (B) The length of CaP axons in control and Sox2 knockout zebrafish at 48 hpf (n = 21 and 33, respectively) and 72 hpf (n = 13 and 29, respectively). (C) The variability of CaP phenotype across segments in controls and Sox2 mutants at 48 and 72 hpf. Circle means control and triangle means Sox2 mutant. (D) The number of branches per 1-mm CaP axon in control and Sox2 knockout zebrafish at 48 hpf (n = 11 and 9, respectively) and 72 hpf (n = 8 and 12, respectively). Each bar represents the mean ± SD. Values with *, **, and *** above the bars are significantly different (P < 0.05, P < 0.01, and P < 0.001, respectively). (E) The schematic for three different primary motoneurons (CaP, MiP, and RoP) in the whole fish and a specific myotome segment.

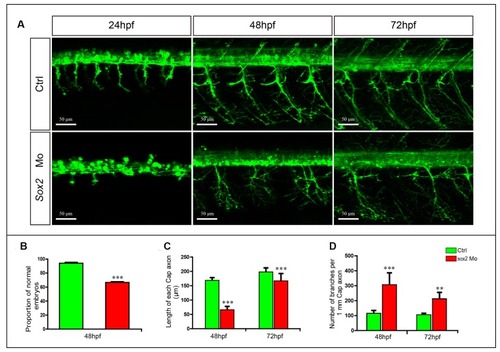
Primary motor neuron developmental defects in the Sox2 morphants. (A) Confocal imaging analysis of primary motor neurons in wild type and Sox2 morphants at 24, 48, and 72 hpf. Scale bar = 50 μm. (B) Quantification of zebrafish embryos with abnormal PMNs (n = 176 and 238, respectively). (C) The length of CaP axons in control and Sox2 morphants at 48 hpf (n = 21 and 32, respectively) and 72 hpf (n = 17 and 19, respectively). (D) The number of branches per 1-mm CaP axon in control and Sox2 morphants at 48 (n = 8 and 7, respectively) and 72 (n = 5 and 6, respectively) hpf. Each bar represents the mean ± SD. Values with ** and *** above the bars are significantly different (P < 0.01 and P < 0.001, respectively).

EXPRESSION / LABELING:
Gene:
Fish:
Knockdown Reagent:
Anatomical Term:
Stage Range: Prim-5 to Protruding-mouth
PHENOTYPE:
Fish:
Knockdown Reagent:
Observed In:
Stage Range: Prim-5 to Protruding-mouth

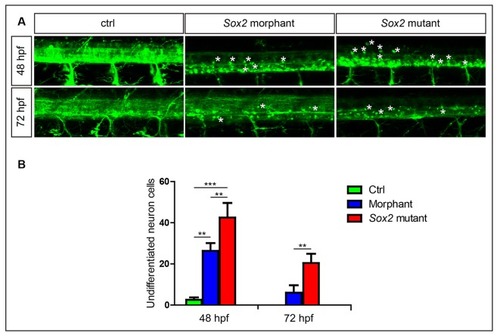
Sox2 deficiency suppressed neuronal cell differentiation. (A) Confocal imaging analysis of primary motor neurons in the control group, Sox2 mutant group, and morphant group at 48 and 72 hpf (n = 4). Asterisks indicate undifferentiated neuronal cells. (B) Quantification of the undifferentiated neuronal cell in the three different groups. Each bar represents the mean ± SD. Values with ** and *** above the bars are significantly different (P < 0.01 and P < 0.001, respectively).

EXPRESSION / LABELING:
Gene:
Fish:
Knockdown Reagent:
Anatomical Term:
Stage Range: Long-pec to Protruding-mouth
PHENOTYPE:
Fish:
Knockdown Reagent:
Observed In:
Stage Range: Long-pec to Protruding-mouth

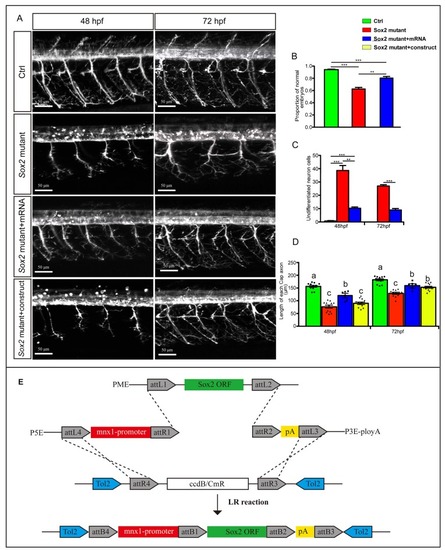
Overexpressions of Sox2 rescued the motor neuron defects in Sox2 mutant embryos. (A) Confocal imaging analysis of primary motor neurons in three different groups at 48 and 72 hpf. Scale bar = 50 μm. (B) Quantification of zebrafish embryos with abnormal PMNs (n = 120, 241, and 132, respectively). (C) Quantification of the undifferentiated neuronal cells in the three different groups (n = 4). Values with ** and *** above the bars are significantly different (P < 0.01 and P < 0.001, respectively). (D) Quantification of the length of CaP axons in the four different groups (n = 12 and 6). Circle means control, triangle means Sox2 mutant, square means Sox2 mutant +mRNA, and inverted triangle means Sox2 mutant +construct. Values with different letters on the top of bars are significantly different (P < 0.05). (E) Multisite Gateway cloning (three-way multisite reaction) to generate a motor neuron specific Tol2 construct for expression of Sox2 mRNA.

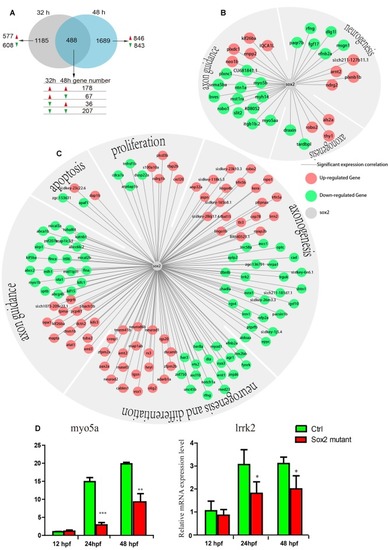
The results of transcriptomic profiling in Sox2 mutant and wild-type zebrafish. (A) The Venn chart in the control and Sox2 knockout treatment group. Differently continuous change types are displayed, red/green arrow means a gene up-/down-regulation at the time point. The expression correlation between Sox2 and differentially expressed genes (DEGs) at 32 h (B) and 48 h (C); in the networks, the green node represents down-regulated DEGs and the red node represents up-regulated DEGs; moreover, all the DEGs were classified into different groups based on biological function. (D) Effects of Sox2 deficiency on the expressions of two motor neuron regulation-related genes. Experimental embryos were sampled at 12, 24, and 48 hpf (n = 12). Each bar represents the mean ± SD. Values with *, ** and *** above the bars are significantly different (P < 0.05, P < 0.01 and P < 0.001, respectively).

Unillustrated author statements

Acknowledgments
This image is the copyrighted work of the attributed author or publisher, and ZFIN has permission only to display this image to its users. Additional permissions should be obtained from the applicable author or publisher of the image. Full text @ Front. Mol. Neurosci.