FIGURE SUMMARY
Title

Type 1 Interleukin-4 Signaling Obliterates Mouse Astroglia in vivo but Not in vitro

Authors
Mashkaryan, V., Siddiqui, T., Popova, S., Cosacak, M.I., Bhattarai, P., Brandt, K., Govindarajan, N., Petzold, A., Reinhardt, S., Dahl, A., Lefort, R., Kizil, C.
Source
Full text @ Front Cell Dev Biol

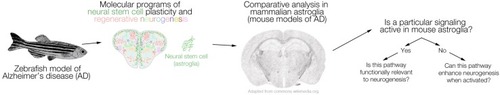
A schematic representation of the comparative logic between zebrafish and mammalian models of Alzheimer’s disease (AD). The regenerative neurogenic ability of zebrafish brain can be harnessed to elucidate the mechanisms, which can be further tested in mouse models of AD. If a particular signaling that enables regeneration in zebrafish brain is active also in mouse brains (e.g., in neural stem cells or progenitors), functional relevance to neurogenesis can be tested. If such a program ceases to exist in mammalian brains, activation of the pathway or its components can be tested as to whether they induce the regenerative neurogenic ability in mammalian brains. We propose this workflow as a stringent comparative analysis pipeline between zebrafish and mammalian brains.

(A–C) 4G8 immunolabeling on brain sections of APP/PS1dE9 AD mouse model (3, 6, 12 months old respectively). (D) 4G8 staining on wild type mouse (12 months old). (E–G) GFAP immunolabeling on brain sections of APP/PS1dE9 mouse (3, 6, 12 months old respectively). (H) GFAP staining on wild type mouse (12 months old). n = 2 animals. Scale bars: 100 μm.

(A–C) BrdU immunostaining on cross sections of wild type mouse hippocampus at 3, 6, and 12 months of age. (A′–C′) BrdU immunostaining on cross sections of APP/PS1dE9 mouse hippocampus at 3, 6, and 12 months of age. (D) Quantification of total BrdU positive cells per mouse hippocampus. Proliferation reduces significantly at 12 months of age in APP/PS1dE9 mouse. n = 4 animals. Scale bars: 100 μm.

(A) Schematic overview of the single cell sequencing procedure. Dissected dentate gyri (DG) of hippocampi were dissociated into single cells, sorted by flow cytometry. Cells were subjected to 10X library preparation, followed by 3′ end transcriptome sequencing and bioinformatics analyses. (B) tSNE plot after cell clustering. (C) Cells from wild type and APP/PS1dE9 mouse DG plotted in different colors on the tSNE supporting a similar cell type composition and distribution. (D) Heat map for cell clusters showing top10 marker genes. (E) Feature plots for several genes known to be markers of various cell types. Cell clusters are named according to the marker gene expression: Mag and Opalin for oligodendrocytes, C1qa and Trem2 for microglia, Lhx5 and Syt1 for neurons, Cldn5 and Acvrl1 for endothelial cells, Ccl5 and Cd2 for T cells, P2ry14 and Notch3 for vasculature, Cldn10 and Gfap for astroglia, Neu4 and Dcx for immature neurons. (F) Named cell clusters on tSNE plot. (G) Expression of Il4r on tSNE plot. IL4 receptor is expressed mainly in microglia and T cells. Very few neurons also express the receptor. Il4r is not expressed in astroglia.

(A) SOX2 and IL4R immunostaining on brain sections of 12 months old wild type mouse. (B) DAPI added to (A). (C) SOX2-positive cells do not express IL4R. (C′) IL4R fluorescence channel alone. (D) GFAP and IL4R immunostaining on brain sections of 12 months old wild type mouse. (E) DAPI added to (D). (F) GFAP-positive cells do not express IL4R. (F′) IL4R fluorescence channel alone. (G) Iba1 and IL4R immunostaining on brain sections of 12 months old wild type mouse. (H) DAPI added to (G). (I) Iba-positive cells express IL4R. (I′) IL4R fluorescence channel alone. n = 3 animals. Scale bars: 100 μm (A,B,D,E,G,H) and 25 μm elsewhere.

(A) Schematic view of cell culture and transduction of adult mouse dentate gyrus astroglia. (B) Immunostaining for GFAP and SOX2 in control cultures. (C) Immunostaining for IL4R in control cultures. (D) Immunostaining for IL4R after transduction with Lv-UbiC:IL4R-GFP. (E) Immunostaining for IL4R and GFP after transduction with Lv-UbiC:GFP. Scale bars: 25 μm.

(A) GFP immunostaining on coronal section of wild type mouse brain after transduction of Lv-UbiC:GFP. (B) Close up image from (A). (C) GFAP and GFP immunostaining showing Lv-UbiC:GFP-transduced astroglia. (D) GFP immunostaining on coronal section of wild type mouse brain after transduction of Lv-UbiC:IL4R-GFP. (E) Close up image from (D). (F) GFAP and GFP immunostaining showing Lv-UbiC:IL4R-GFP-transduced astroglia. n = 3 wild type animals. Scale bars: 100 μm (A,D), 25 μm (B,E), and 10 μm (C,F).

(A) Immunostaining for GFAP (red) and GFP after transplantation of astroglia transduced with Lv-UbiC:GFP into wild type mouse cortex. (B) Immunostaining for OLIG2 (red) and GFP after transplantation of astroglia transduced with Lv-UbiC:GFP into wild type mouse cortex. (C) Immunostaining for GFP after transplantation of astroglia transduced with Lv-UbiC:GFP into adult mouse cortex shows neuronal morphologies. (D) Immunostaining for GFP after transplantation of astroglia transduced with Lv-UbiC:STAT6VT-GFP into adult mouse cortex. (E) Immunostaining for OLIG2 (red) and GFP after transplantation of astroglia transduced with Lv-UbiC:STAT6VT-GFP into wild type mouse cortex. (F) Immunostaining for GFAP (red) and GFP after transplantation of astroglia transduced with Lv-UbiC:STAT6VT-GFP into wild type mouse cortex. (G) Immunostaining for GFAP (orange) and GFP after transplantation of astroglia transduced with Lv-UbiC:GFP into APP/PS1dE9 adult mouse cortex. (H) Immunostaining for GFAP (orange) and GFP after transplantation of astroglia transduced with Lv-UbiC:STAT6VT-GFP into APP/PS1dE9 adult mouse cortex. n = 3 animals. Schematic information on injection locations presented in the insets. Scale bars: 50 μm.

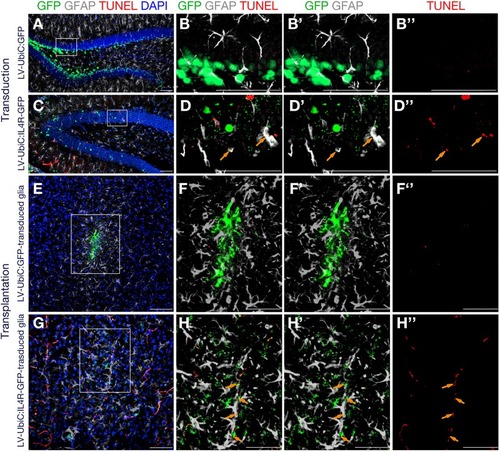
Immunostaining for GFAP (gray) and GFP (green) coupled to TUNEL staining (red). (A) Wild type mouse hippocampus transduced with Lv-UbiC:GFP. (B) Higher magnification of the framed region in (A) without DAPI. (B′) Overlaid GFP and GFAP channels. (B′′) TUNEL staining as single fluorescence channel. (C) Wild type mouse hippocampus transduced with Lv-UbiC:IL4R-GFP. (D) Higher magnification of the framed region in (D) without DAPI. (D′) Overlaid GFP and GFAP channels. (D′′) TUNEL staining as single fluorescence channel. (E) Wild type mouse cortex transplanted with Lv-UbiC:GFP-transduced astroglia. (F) Higher magnification of the framed region in (E) without DAPI. (F′) Overlaid GFP and GFAP channels. (F′′) TUNEL staining as single fluorescence channel. (G) Wild type mouse cortex transplanted with Lv-UbiC:IL4R-GFP-transduced astroglia. (H) Higher magnification of the framed region in (G) without DAPI. (H′) Overlaid GFP and GFAP channels. (H′′) TUNEL staining as single fluorescence channel. Orange arrows show TUNEL-positive, transduced glia. All animals are WT. n ≥ 3 wild type animals. Scale bars: 100 μm.

Acknowledgments
This image is the copyrighted work of the attributed author or publisher, and ZFIN has permission only to display this image to its users. Additional permissions should be obtained from the applicable author or publisher of the image. Full text @ Front Cell Dev Biol