
- Title
-
Chemoptogenetic ablation of neuronal mitochondria in vivo with spatiotemporal precision and controllable severity
- Authors
- Xie, W., Jiao, B., Bai, Q., Ilin, V.A., Sun, M., Burton, C.E., Kolodieznyi, D., Calderon, M.J., Stolz, D.B., Opresko, P.L., St Croix, C.M., Watkins, S., Van Houten, B., Bruchez, M.P., Burton, E.A.
- Source
- Full text @ Elife
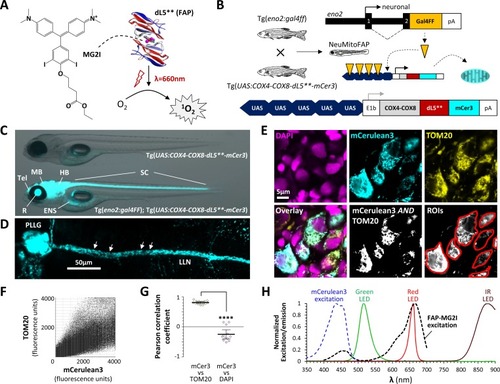
Generation of NeuMitoFAP zebrafish.(A) When the fluorogen MG2I (chemical structure shown on left) is bound to the fluorogen-activating protein (FAP) dL5** (right), excitation by far-red light causes generation of singlet oxygen. (B) Diagrams of transgene constructs eno2:gal4FF (above) and UAS:COX4-COX8-dL5**-mCer3 (below). Transactivation of the UAS enhancer by Gal4 in the neurons of double transgenic Tg(eno2:gal4ff); Tg(UAS:COX4-COX8-dL5**-mCer3) ‘NeuMitoFAP’ zebrafish results in expression of the dL5**-mCerulean3 fusion protein in the mitochondrial matrix. (C) Merged phase contrast and mCerulean3 epifluorescence images, showing live Tg(UAS:COX4-COX8-dL5**-mCer3) (above) and Tg(eno2:gal4ff); Tg(UAS:COX4-COX8-dL5**-mCer3) (NeuMitoFAP; below) zebrafish larvae at 5 days post-fertilization. mCerulean3-expressing structures are labeled (Tel, telencephalon; MB, midbrain; HB, hindbrain; SC, spinal cord; R, retina, ENS enteric nervous system). (D) Confocal z-plane projection showing mCerulean3 expression in the posterior lateral line ganglion (PLLG) and lateral line nerve (LLN) of a NeuMitoFAP zebrafish. Individual axonal mitochondria are indicated (arrows). (E) Brain sections from NeuMitoFAP zebrafish were labeled for nuclei (DAPI; magenta), dL5**-mCerulean3 (cyan) and mitochondria (TOM20; yellow). Single confocal planes of the individual channels are shown in the upper row. The lower row shows: the three channels overlaid; the output of a Boolean (mCerulean3 AND TOM20) map; and representative regions of interest that were analyzed in panels F and G. (F) Scatter plot of TOM20 signal (y-axis) versus mCerulean3 signal (x-axis) in each pixel within regions of interest. (G) Pearson correlation coefficient of signal intensity for mCerulean3 versus TOM20 (left) compared with mCerulean3 versus DAPI (right). Each data point shows a region of interest corresponding to an individual mCerulean3-expressing cell, bars show mean ± SE; ****p<0.0001, 2-tailed t-test. (H) Normalized excitation and emission spectra of the fluorophores and light sources used in this study. |
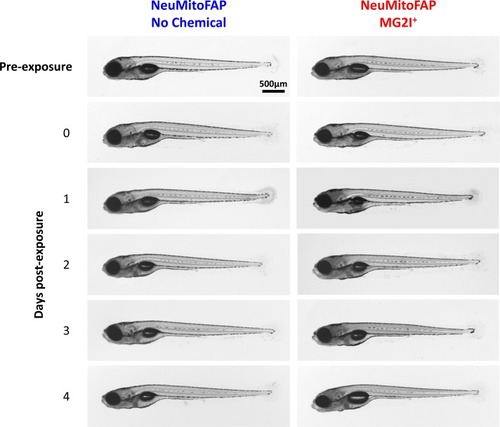
Transmitted light micrographs of NeuMitoFAP zebrafish: tThe right column shows larvae that were exposed to MG2I from 3 dpf; the left column shows untreated zebrafish. The first row shows larvae at 5dpf prior to light exposure. The second row shows larvae at 5dpf immediately after exposure to 60 J/cm2 light at λpeak=661nm. The subsequent rows show larvae at daily intervals (6–9 dpf) following light exposure at 5dpf. Although the MG2I-treated, light-exposed larvae showed loss of motor responses that did not recover during the time course of the experiment (see text), there were no major morphological abnormalities at any time point. |
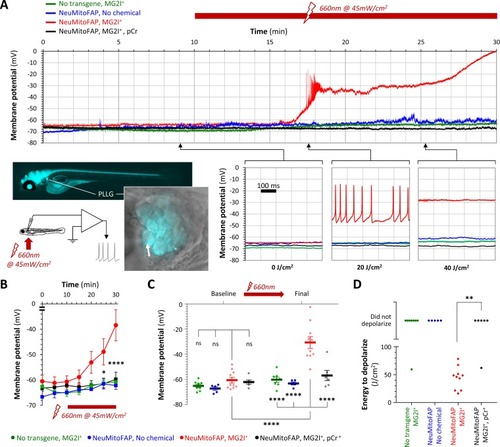
Acute neuronal depolarization in NeuMitoFAP zebrafish exposed to MG2I and far-red light.(A) Whole-cell patch clamp recordings were made from posterior lateral line ganglion (PLLG) sensory neurons. The inset figure shows the preparation and experimental design (the arrow shows a patch-clamp pipette in contact with a mitoFAP-expressing neuron). Recordings were made for 30–40 min (10 min in darkness and then a further 20–30 min under illumination in far-red light at λpeak=661 nm). The graphs show example traces of membrane potential (y-axis) against time (x-axis), for the full 30 min recording (upper graph) and for three 500 ms sweeps after cumulative far-red light doses of 0, 20 or 40 J/cm2 as indicated. Experimental groups: WT zebrafish exposed to MG2I (green); NeuMitoFAP zebrafish (blue); NeuMitoFAP zebrafish exposed to MG2I (red); NeuMitoFAP zebrafish exposed to MG2I, recordings made with phosphocreatine (pCr) added to pipette solution (black). (B) Mean ± SE membrane potential (y-axis; 5–10 neurons per group) in each 5 min time bin (x-axis) during recording. *p<0.05, ****p<0.0001, NeuMitoFAP-MG2I versus other groups at same time point, 2-way repeated measures ANOVA with Tukey multiple comparisons test. (C) Membrane potential of lateral line ganglion neurons (y-axis) at baseline and final potential after far-red light exposure. Data points show individual neurons, bars show mean ± SE. ****p<0.0001, 1-way ANOVA with Tukey multiple comparison test. (D) Amount of far-red light energy necessary to decrease membrane potential by >20% from baseline value (y-axis). Data points show individual neurons. Neurons that did not depolarize during the recording period are shown above the graph. **p<0.01, Fisher’s exact test. |
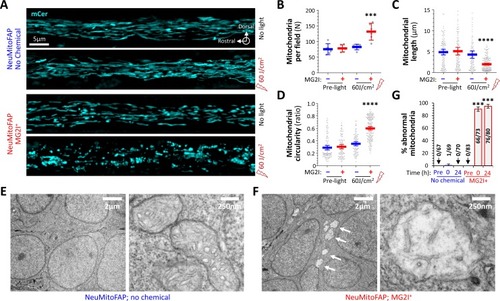
Disruption of mitochondrial structure in NeuMitoFAP zebrafish exposed to MG2I and far-red light.(A) Confocal Z-plane projections showing mCerulean-labeled mitochondria in the lateral line nerves of live NeuMitoFAP zebrafish in the absence (upper images) or presence (lower images) of MG2I, before (upper image of each pair) or after (lower image of each pair) exposure to 60 J/cm2 light at λpeak=661 nm. (B - D) The (B) number of mitochondria per field, (C) mitochondrial length, and (D) mitochondrial circularity were quantified in z-plane projections of the entire medio-lateral extent of the lateral line nerve in 6 zebrafish per group. Bars show mean ± 95% CI for NeuMitoFAP zebrafish in the absence (blue) or presence (red) of MG2I, before or after exposure to far-red light. Data points show individual zebrafish (panel B) or individual mitochondria (panels C, D). ***p<0.001, ****p<0.0001, NeuMitoFAP-MG2I post-light versus each other group individually, 1-way ANOVA with Tukey multiple comparisons test. (E, F) Transmission electron micrographs of sections from the telencephalon of NeuMitoFAP zebrafish immediately after exposure to far-red light in the (F) presence or (E) absence of MG2I. The left image of each pair shows a low-magnification view, and the right image shows a high-magnification view illustrating the ultrastructure of individual neuronal mitochondria. Arrows in panel F show swollen, damaged mitochondria. (G) The proportion of abnormal mitochondria was quantified by a blinded observer in 12 electron micrographs each from 6 experimental groups (NeuMitoFAP with or without MG2I, before, 0 or 24 hr after 60 J/cm2 far-red light exposure). Bars show mean ± SE% abnormal mitochondria per section in each group. Numbers of total and abnormal mitochondria in each group are shown. ***p<0.001, compared individually with each control (pre-light and no chemical) group, 1-way ANOVA with Tukey multiple comparisons test. |
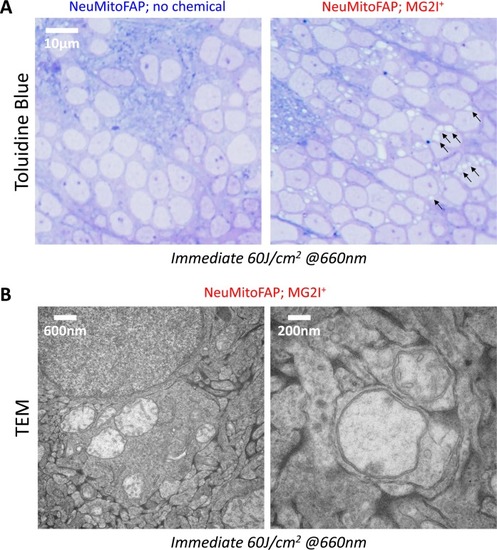
NeuMitoFAP zebrafish larvae were treated with MG2I or no chemical from 3 to 5 dpf and then exposed to 60 J/cm2 light at λpeak=661 nm, following which they were fixed immediately for electron microscopy. ( |
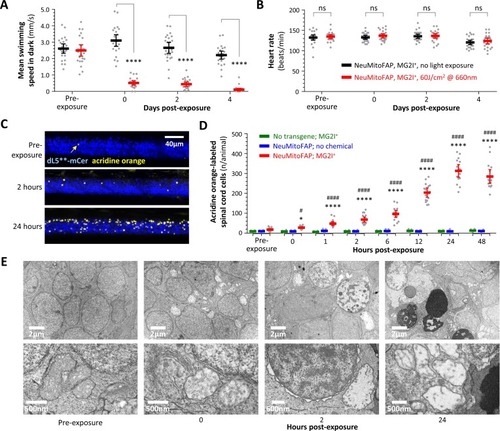
Persistent neurological deficits and cell death in NeuMitoFAP zebrafish exposed to MG2I and far-red light.(A) Mean swimming speed of NeuMitoFAP zebrafish treated with MG2I was quantified during the dark phase of the visual motor response (y-axis) after exposure to 60 J/cm2 far-red light (red) or no exposure (black). Data points show responses of individual zebrafish before light exposure and afterwards at the time points indicated (x-axis). Bars show group mean ± 95% CI. ****p<0.0001, 2-way ANOVA with Šidák multiple comparisons test. (B) Heart rate (y-axis) was quantified in the same experimental groups and time points as panel A. Data points show heart rates of individual zebrafish, bars show group mean ± 95% CI. (C) Degenerating cells in MG2I-treated NeuMitoFAP zebrafish were labeled with acridine orange, before, and 2 and 24 hr after exposure to 60 J/cm2 far-red light. The images show confocal z-plane projections through the spinal cord of immobilized live zebrafish larvae. dL5**-mCerulean3 is pseudocolored blue and acridine orange-labeled cells yellow. (D) Acridine orange-labeled cells in the spinal cord of live zebrafish were counted (y-axis), before far-red light exposure and at the indicated time points afterwards (x-axis). Experimental groups: WT zebrafish treated with MG2I (green), NeuMitoFAP zebrafish (blue), NeuMitoFAP zebrafish treated with MG2I (red). Data points show individual zebrafish, bars show mean ± SE. *p<0.05, ****p<0.0001, NeuMitoFAP-MG2I zebrafish versus other groups at the same time point; #p<0.05, ####p<0.0001, NeuMitoFAP-MG2I zebrafish at the indicated time point versus pre-exposure value; 2-way ANOVA with Tukey multiple comparisons test. (E) Transmission electron micrographs of sections from the telencephalon of NeuMitoFAP zebrafish treated with MG2I before, and at the indicated time points after, far-red light exposure. The upper image of each pair shows a low-magnification view, and the lower image shows a high-magnification view illustrating ultrastructural features. |
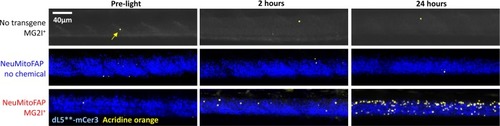
Delayed CNS cell death in NeuMitoFAP zebrafish exposed to MG2I and far-red light.Similar micrographs are shown as in Figure 6C, and quantified in Figure 6D, but including the control groups in comparison with NeuMitoFAP-MG2I larvae, before exposure, 2 hr after, and 24 hr after exposure to 60 J/cm2 far-red light at λpeak=661 nm. Segments of the spinal cord of live anesthetized zebrafish larvae were imaged using confocal microscopy for mCerulean3 (pseudocolored blue) and Acridine Orange (pseudocolored yellow). Under the zebrafish eno2 promoter element (Bai et al., 2007), the dL5**-mCerulean3 fusion protein is expressed in the mitochondria of most neurons in NeuMitoFAP zebrafish, so the spinal cord is outlined by the mCerulean3 fluorescence signal, providing a convenient anatomical landmark. There is no mCerulean3 signal in non-transgenic zebrafish (top row). The number of Acridine Orange-labeled cells in the spinal cord increased dramatically in NeuMitoFAP-MG2I zebrafish, but not controls, following exposure to far-red light (see Figure 6D for quantification and statistical analysis). |