FIGURE SUMMARY
Title

Recellularized Colorectal Cancer Patient-derived Scaffolds as in vitro Pre-clinical 3D Model for Drug Screening

Authors
Sensi, F., D'Angelo, E., Piccoli, M., Pavan, P., Mastrotto, F., Caliceti, P., Biccari, A., Corallo, D., Urbani, L., Fassan, M., Spolverato, G., Riello, P., Pucciarelli, S., Agostini, M.
Source
Full text @ Cancers

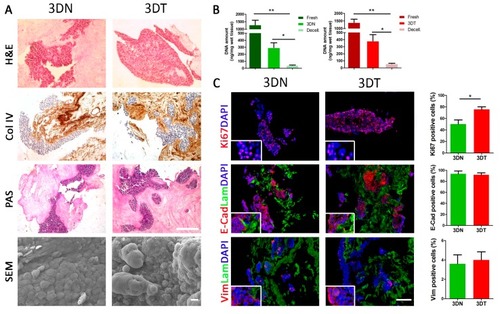
Characterization of matched 3DN and 3DT HT29-recellularized samples. (A) histological characterization of sections stained with hematoxylin and eosin (H&E), collagen IV staining (Col IV), and periodic acid-Shiff (PAS) (scale bar = 200 µm). Scanning electron microscopy (SEM) analysis performed on 3DN and 3DT (Scale bar = 10 µm). (B) DNA amount quantification in fresh samples, after decellularization and 5 days of culture after seeding of HT29 cells, in both 3DN and 3DT. (C) IF staining in 3DT and 3DN and relative quantifications: Ki67, as proliferation marker; E-cadherin, as epithelial marker; vimentin, as mesenchymal marker; laminin to highlight basement membrane; DAPI to counterstain the nuclei (scale bar = 100 µm) (* p-value < 0.05; ** p-value < 0.01).

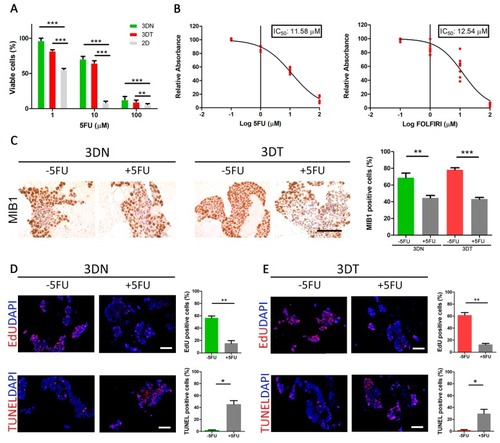
Effect of 5-fluorouracil (5FU) and FOLFIRI ((leucovorin + 5-fluorouracil (5FU) + irinotecan) treatments on HT29-cells cultured in a 3D model. (A) Comparison between percentages of viable cells (by absorbance fold-change detection) after administration of 5FU at 1-10-100 μM in 2D cultures and in both 3DN and 3DT models. (B) Calculation of 5FU and FOLFIRI 3D IC50 by nonlinear regression. (C) MIB1 immunohistochemistry before and after administration of 3D-calculated IC50 in both 3DN and 3DT; comparison of percentages of MIB1+ cells before and after treatment (scale bar = 100 µm). (D) EdU staining as a marker of proliferation and TUNEL staining as a marker of apoptosis, before and after 5FU treatment in 3DN and relative quantification (scale bar = 100 µm). (E) EdU and TUNEL before and after 5FU treatment in 3DT and relative quantification (scale bar = 100 µm) (* p-value < 0.05; ** p-value < 0.01; *** p-value < 0.001).

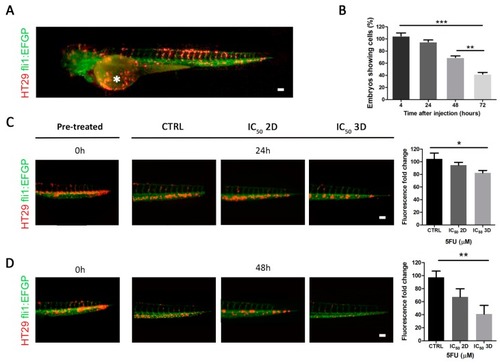
Effect of 5FU treatment on in vivo zebrafish model. (A) Tg(fli1:EGFP) zebrafish embryo (with green fluorescent vessels) xenotransplantated with Dil marked HT29 cells (red), injected into the duct of Cuvier (white asterisk). (B) The monitoring of zebrafish embryos showed viable cells after 24-48-72 h post-injection. (C) Analysis of Dil+ HT29 injected cells in zebrafish embryos, pre-treatment (time 0), after 24 h of treatment with DMSO (control group), IC50 2D, IC50 3D, and relative quantifications (scale bar = 100 µm). (D) Analysis of Dil+ HT29 injected cells in zebrafish embryos, pre-treatment (time 0), after 48 h of treatment with DMSO (control group), IC50 2D, IC50 3D, and relative quantifications (scale bar = 100 µm) (* p-value < 0.05; ** p-value < 0.01; *** p-value < 0.001).

EXPRESSION / LABELING:
Gene:
Fish:
Anatomical Term:
Stage: Day 5

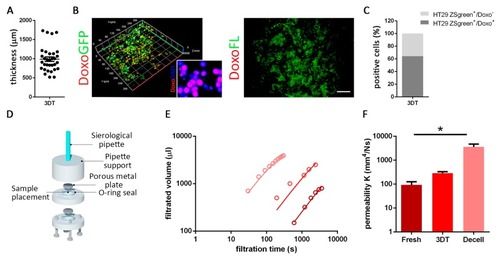
Drug diffusion evaluation. (A) Thickness (µm) of a 3DT. (B) Doxorubicin (doxo; red) diffusion assay in 3DT, repopulated with HT29 ZSgreen positive cells (green). In the enlargement, the same fixed samples were evaluated with immunofluorescence to underline the co-localization between drug (doxo) and nuclei (DAPI). Absence of non-specific binding between doxo and extracellular matrix (ECM) (scale bar = 100 µm). (C) Quantification of co-localized signals. (D) In-house developed permeability device. (E) Experimental results of the filtration process carried out on the tumor colon fresh, 3DT, and decellularized (decell). Open circles refer to the experimental values, and solid black lines to the Equation (2) fitted to experimental data, and the charts report the estimated values of permeability K (mm4/Ns). (F) Quantification of permeability measurement obtained from fresh, 3DT, and decellularized (decell) tumor samples. (* p-value < 0.05; ** p-value < 0.01; *** p-value < 0.001).

Acknowledgments
This image is the copyrighted work of the attributed author or publisher, and ZFIN has permission only to display this image to its users. Additional permissions should be obtained from the applicable author or publisher of the image. Full text @ Cancers