
- Title
-
Follistatin is a novel therapeutic target and biomarker in FLT3/ITD acute myeloid leukemia
- Authors
- He, B.L., Yang, N., Man, C.H., Ng, N.K., Cher, C.Y., Leung, H.C., Kan, L.L., Cheng, B.Y., Lam, S.S., Wang, M.L., Zhang, C.X., Kwok, H., Cheng, G., Sharma, R., Ma, A.C., So, C.E., Kwong, Y.L., Leung, A.Y.
- Source
- Full text @ EMBO Mol. Med.
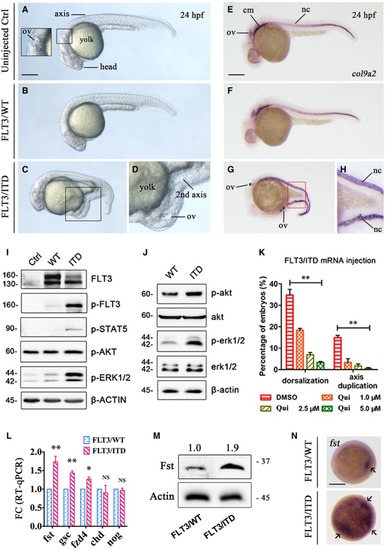
The morphology of uninjected, Whole‐mount FLT3 signaling was detected by Western blotting in 293FT cells transfected with The effect of FLT3 inhibitor quizartinib (Qui) on the dorsalization and axis duplication phenotype induced by Quantification of |
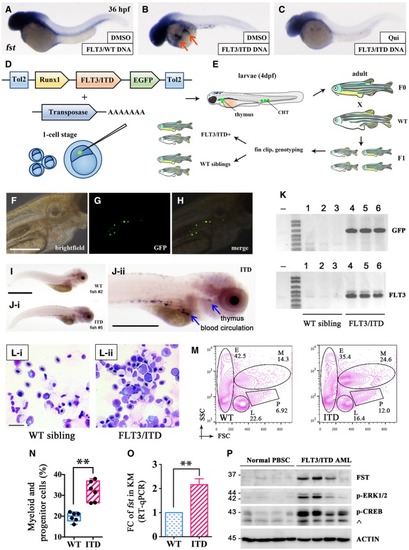
WISH of Generation and characterization of Kidney marrow (KM) was collected from Runx1‐ Expression of Detection of FST expression, p‐ERK1/2, and p‐CREB in mononuclear cells from normal peripheral blood stem cell (PBSC) and |
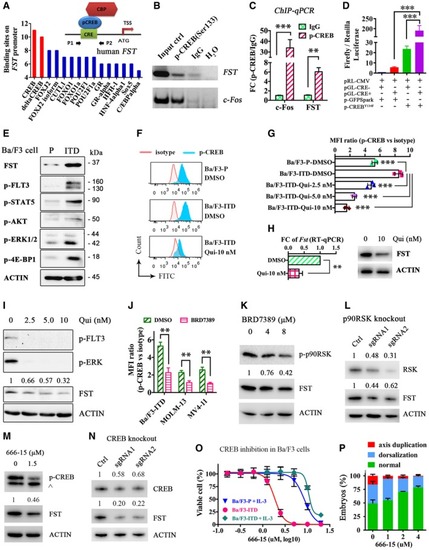
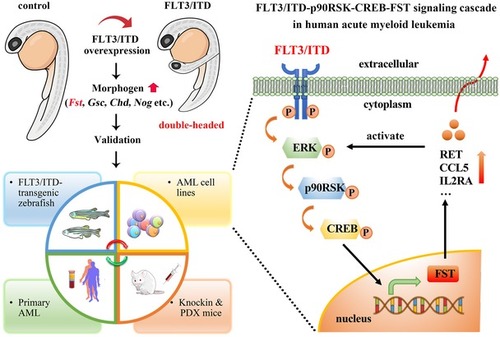
The direct binding of p‐CREB to human Dual‐luciferase assay demonstrating the direct binding of p‐CREB on human FST promoter. pRL‐CMV, Renilla luciferase vector; pGL‐CRE− and pGL‐CRE+, firefly luciferase expression driven by human FST expression and Phospho‐flow analysis of p‐CREB in Ba/F3‐parental, Ba/F3‐ The expression of FST and phosphorylation of CREB were detected by Western blotting (I and K) and phospho‐flow analysis (J) in MOLM‐13 (I) and Ba/F3‐ RSK expression and FST expression were detected by Western blotting after p90RSK knockout by CRISPR/Cas9 in MOLM‐13 cells. The phosphorylation of CREB and FST expression was detected by Western blotting in Ba/F3‐ CREB expression and FST expression were detected by Western blotting after CREB knockout by CRISPR/Cas9 in MOLM‐13 cells. The growth of Ba/F3‐parental (with IL‐3), Ba/F3‐ The rescue effect of CREB inhibitor 666‐15 on PHENOTYPE:
|
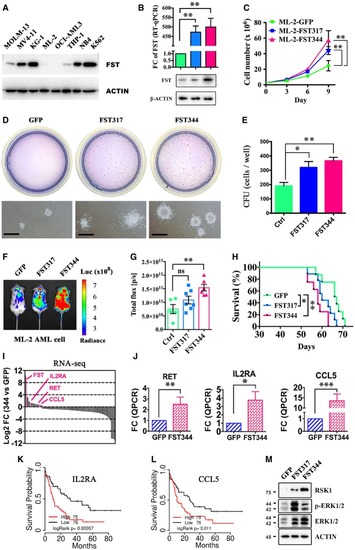
FST expression in different AML cell lines was detected by Western blotting. The clonogenicity of ML‐2 overexpressing The engraftment of ML‐2 (with luciferase gene) overexpressing RNA‐seq and RT–qPCR validation of upregulation of Overall survival analysis of patients from TCGA‐AML based on the differential expression of Activation of MAPK/ERK pathway in ML‐2 by |
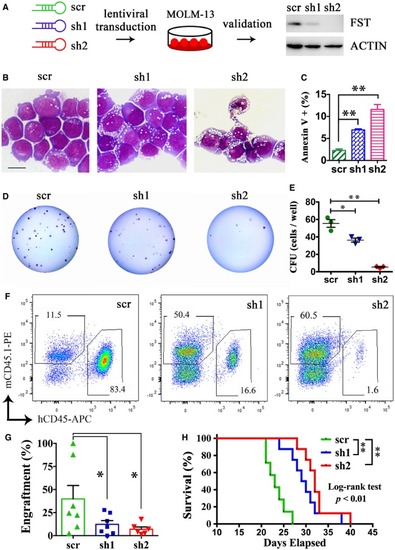
The morphology (B), apoptosis (C), and clonogenicity of MOLM‐13 (D and E) were measured after The engraftment of MOLM‐13 after The effect of |
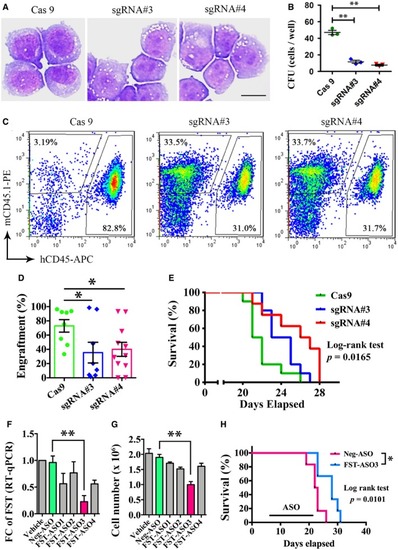
The morphology and clonogenicity of MOLM‐13 after The engraftment of MOLM‐13 after The effect of The knockdown efficiency of different MOLM‐13 cell growth was measured after 3 days of treatment of Intraperitoneal injection of |
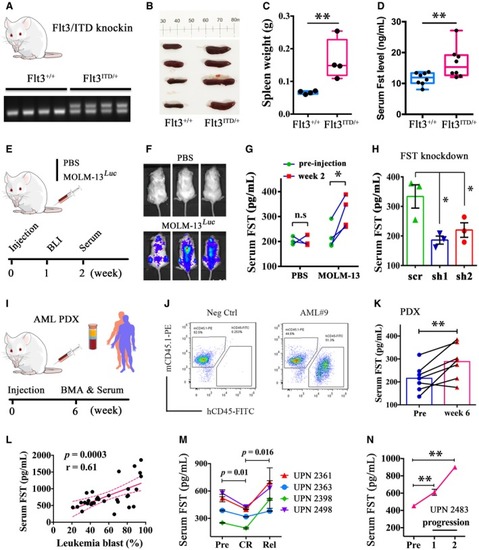
The engraftment of MOLM‐13 in NSG mice was confirmed at week 1 post‐injection (E, F). Serum FST level was measured in MOLM‐13‐engrafted NSG mice at pre‐injection and week 2 post‐injection (G, PBS group, 3 mice; MOLM‐13 group, 4 mice). After Serum FST level was significantly increased in primary AML‐derived xenografted mouse at week 6 post‐injection. Human primary AML cells ( Correlation between serum FST levels and leukemia blast percentage from FLT3/ITD‐mutated AML at diagnosis. Correlation analysis (Pearson's correlation coefficient) was performed by GraphPad Prism 6. Serum FST decreased in CR and increased after relapse in 4 AML patients receiving quizartinib monotherapy. Serum FST continued to rise during disease progression from a patient who did not respond to quizartinib. Patients in (M) and (N) were recruited in the QUANTUM‐R, and patient accrual has been completed. |
|