FIGURE SUMMARY
Title

The evolution of zebrafish RAG2 protein is required for adapting to the elevated body temperature of the higher endothermic vertebrates

Authors
Sun, A., Xu, K., Liu, H., Li, H., Shi, Y., Zhu, X., Liang, T., Li, X., Cao, X., Ji, Y., Jiang, T., Xu, C., Liu, X.
Source
Full text @ Sci. Rep.

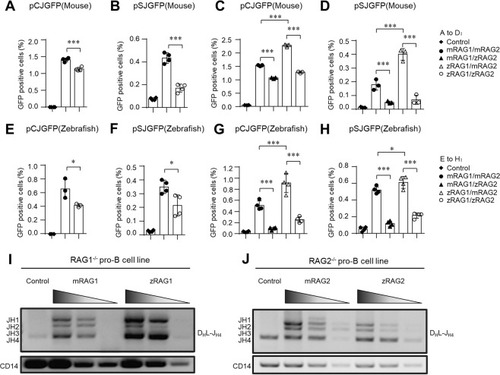
The recombination efficiency of zRAG is lower than that of mRAG at 37 °C. NIH3T3 cells were co-transfected with pCJGFP (mouse) (A,C), pSJGFP (mouse) (B,D), pCJGFP (zebrafish) (E,G) and pSJGFP (zebrafish) (F,H) and the indicated RAG1 and RAG2 using Lipo6000 transfection reagent. The GFP level was measured by flow cytometry to assess the recombination efficiency. The percentages of GFP positive cells were shown (the mean ± SD was calculated from triplicate experiments). (I,J) PCR analyses of the indicated DHJH family rearrangements in RAG1-deficient pro-B cells (I) or RAG2-deficient pro-B cells (J). Input control: CD14 (bottom). PCR amplification was performed with fivefold serial dilutions of genomic DNA. The results are typical of three experiments. Bands related to rearrangements of various JH segments are indicated on the left. The error bars indicate the SDs. The data are presented as the mean ± standard deviation. *P < 0.05, **P < 0.01 and ***P < 0.001 by Student’s t test.

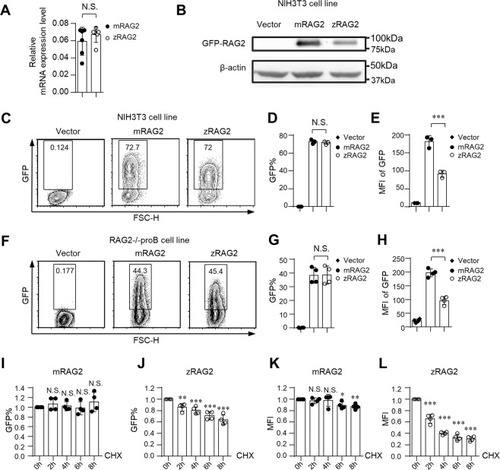
The zRAG2 protein is unstable compared to the mRAG2 protein at 37 °C. (A) Both zRAG2 and mRAG2 had the similar mRNA expression. The mRNA expression levels were normalized to β-actin expression. (B) The zRAG2 protein showed a lower expression level than the mRAG2 protein. β-actin served as a loading control for western blot analysis. (CE) and (FH) The zRAG2 protein showed an expression level similar to that of the mRAG2 protein, but its MFI was lower than that of mRAG2. zRAG2-GFP fusion protein and mRAG2-GFP fusion protein were introduced into NIH3T3 cells (CE) or RAG2-deficient pro-B cells (FH) by the retrovirus-mediated gene transfer method. After 36 h, GFP expression and intensity were analyzed by FACS. (IL) The zRAG2 level was sensitive to proteasome degradation. RAG2-deficient pro-B cells were treated with CHX for 8 hours. GFP intensity was analyzed by FACS. (I,J) The GFP% of mRAG2 and zRAG2 was shown; (K,L) The MFI of mRAG2 and zRAG2 was shown. The error bars indicate the SDs. The data are presented as the mean ± standard deviation. *P < 0.05, **P < 0.01 and ***P < 0.001 by Student’s t test; N.S.: no significance.

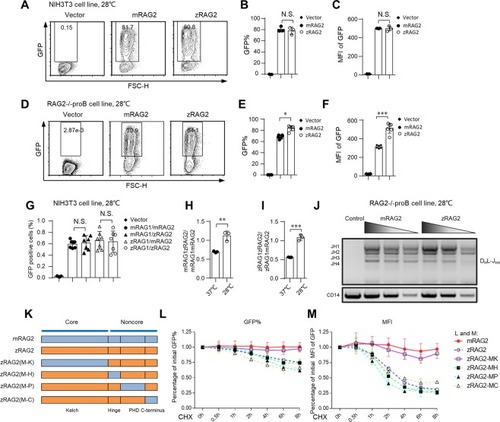
The protein stability and recombination efficiency of zRAG2 are similar to those of mRAG2 at 28 °C. (AF) The zRAG2 protein showed an expression level similar to that of the mRAG2 protein, and its MFI was also similar to that of mRAG2 or even higher at 28 °C. zRAG2-GFP fusion protein and mRAG2-GFP fusion protein were introduced into NIH3T3 cells (AC) or RAG2-deficient pro-B cells (DF) by the retrovirus-mediated gene transfer method. The cells were first incubated for 36 h at 37 °C, and they were transferred to 28 °C after this time. After 48 h at 28 °C, GFP expression and intensity were analyzed by FACS. (G) NIH3T3 cells were transfected with pCJGFP using Lipo6000 transfection reagent. The GFP level was measured by flow cytometry to assess the recombination efficiency. The percentages of GFP-positive cells were shown (the means ± SDs were calculated from triplicate experiments). (H,I) The RAG1zRAG2/mRAG1mRAG2 and zRAG1zRAG2/zRAG1mRAG2 ratios were shown. (J) PCR analyses of the indicated DHJH family rearrangements in RAG2-deficient pro-B cells at 28 °C. Input control: CD14 (bottom). PCR amplification was performed with fivefold serial dilutions of genomic DNA. The results are typical of three experiments. Bands related to rearrangements of various JH segments are indicated on the left. (KM) Different mouse RAG2 domains were substituted for the corresponding zRAG2 domains. GFP% (L) and MFI (M) are shown from 0 h to 8 h after treatment with the 20 μg/ml CHX. MK, mouse Kelch; MH, mouse hinge; MP, mouse PHD; MC, mouse C-terminus. The error bars indicate the SDs. The data are presented as the mean ± standard deviation. *P < 0.05, **P < 0.01 and ***P < 0.001 by Student’s t test; N.S.: no significance.

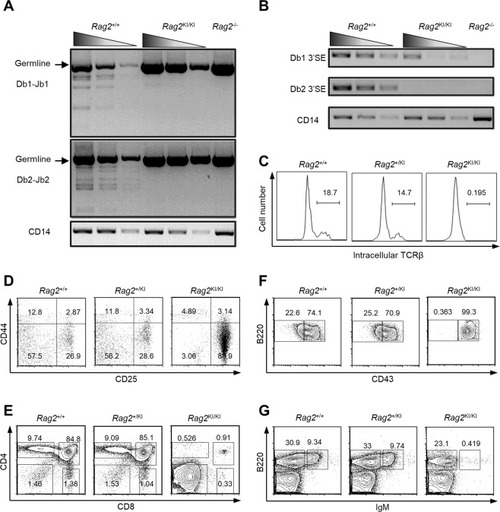
The V(D)J recombination of Rag2KI/KI mice is severely impaired. Flow cytometric analysis of T and B cell development in Rag2+/+, Rag2+/KI and Rag2KI/KI mice. (A,B) TCRβ rearrangement was found to be decreased via semiquantitative PCR, which was used to detect Dβ-Jβ rearrangement in DN3 thymocytes (CD4CD8CD44CD25+ population) sorted from Rag2KI/KI mice, their WT littermates and RAG2−/− mice. Input control: CD14 (bottom). PCR amplification was performed with fivefold serial dilutions of genomic DNA. The results are representative of three independent experiments. (C) The intracellular TCRβ expression level in Rag2KI/KI mice was largely diminished compared to that in Rag2+/+ or Rag2KI/+ mice. The TCRβ expression level was measured by flow cytometry. (DG) The surface expression of CD4, CD8, B220, IgM, and CD43 in Rag2KI/KI mice (mice with two zRAG2 knock-in alleles) and Rag2+/+ mice (WT littermates) was analyzed by flow cytometry. (D) CD44 and CD25 surface expression in DN cells of the thymus. (E) CD4 and CD8 surface expression on thymocytes. (F) IgM bone marrow cells were analyzed for surface expression of B220 and CD43. (G) The B220 and IgM surface expression on bone marrow cells. The results are representative of three independent experiments.

Rag2KI/KI mice develop severe cachexia syndromes. (A) Representative photographs of 2 months old Rag2KI/KI mice and wild-type Rag2+/+ littermates. (B) Skin was stripped from the hind limbs of 60 days old mice for gross comparisons of muscle mass. (C) Total body weight of 2 months old Rag2+/+ mice (n = 9) Rag2KI/KI mice (n = 9). (D) Representative photographs of lungs and livers from 2–5 months old Rag2KI/KI mice and wild-type Rag2+/+ littermates. (E) Representative H&E staining of lung and liver sections at 2–5 months old Rag2KI/KI mice and wild-type Rag2+/+ littermates. (F) Kaplan–Meier curves of Rag2+/+ mice, Rag2KI/KI mice and Rag2/ mice (Rag2+/+ mice, n = 14; Rag2KI/KI mice, n = 14; Rag2/ mice, n = 9). Chi square log-rank test was used for statistical analysis. The results are representative of three independent experiments. The error bars indicate the SDs. The data are presented as the mean ± standard deviation. *P < 0.05, **P < 0.01 and ***P < 0.001 by Student’s t test.

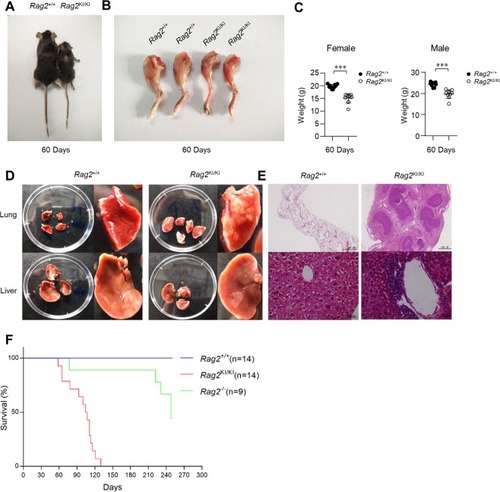
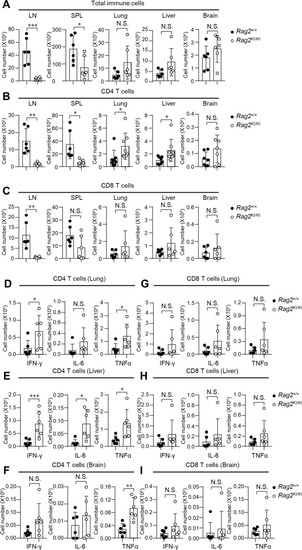
T cells that produced cachexia cytokines of Rag2KI/KI mice are disordered. (A) Total immune cells of lymph nodes (LN), spleen (SPL), lung, liver and brain from Rag2+/+ and Rag2KI/KI mice. Rag2+/+ mice (n = 6); Rag2KI/KI mice (n = 6). (B) The absolute CD4 T cells of LN, SPL, lung, liver and brain from Rag2+/+ and Rag2KI/KI mice. Rag2+/+ mice (n = 6); Rag2KI/KI mice (n = 6). (DF) The disorder of IFN-γ, IL-6 and TNFα of CD4 T cells in lung (D), liver (E) and brain (F) from Rag2+/+ and Rag2KI/KI mice was analyzed. Rag2+/+ mice (n = 6); Rag2KI/KI mice (n = 6). (C) The absolute CD8 T cells of LN, SPL, lung, liver and brain from Rag2+/+ and Rag2KI/KI mice. Rag2+/+ mice (n = 6); Rag2KI/KI mice (n = 6). (GI) The disorder of IFN-γ, IL-6 and TNFα of CD8 T cells in lung (G), liver (H) and brain (I) from Rag2+/+ and Rag2KI/KI mice was analyzed. Rag2+/+ mice (n = 6); Rag2KI/KI mice (n = 6). All cytokines were detected by flow cytometric analysis after in vitro stimulation with PMA (phorbol 12-myristate 13-acetate) and ionomycin in the presence of brefeldin A for 4 h. The error bars indicate the SDs. The data are presented as the mean ± standard deviation. *P < 0.05, **P < 0.01 and ***P < 0.001 by Student’s t test; N.S.: no significance.

Acknowledgments
This image is the copyrighted work of the attributed author or publisher, and ZFIN has permission only to display this image to its users. Additional permissions should be obtained from the applicable author or publisher of the image. Full text @ Sci. Rep.