
- Title
-
Histone variant dictates fate biasing of neural crest cells to melanocyte lineage
- Authors
- Raja, D.A., Subramaniam, Y., Aggarwal, A., Gotherwal, V., Babu, A., Tanwar, J., Motiani, R.K., Sivasubbu, S., Gokhale, R.S., Natarajan, V.T.
- Source
- Full text @ Development
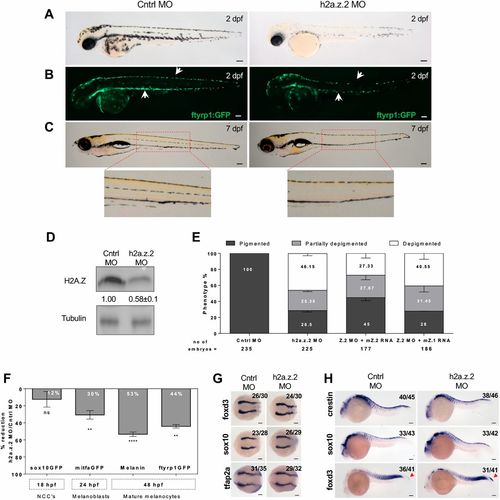
H2a.z.2 controls melanocyte numbers during zebrafish development. (A) Bright-field images of control MO- and H2a.z.2 MO-injected embryos (Z2 MO) at 2 days postfertilization (dpf). (B) Fluorescence images of Tg(ftyrp1:GFP) that tags differentiating melanophores, in control and Z2 MO embryos at 2 dpf. White arrows indicate the dorsal and ventral stripe of melanophores. (C) Bright-field images of control and Z2 MO at 7 dpf. Insets show enlarged views of the lateral line melanophores. (D) Western blot analysis of control and Z2 MO embryos at 2 dpf, carried out using an antibody that recognizes both H2A.Z.1 and H2A.Z.2 proteins, referred to together as H2AZ. Numbers refer to fold change normalized to H3. (E) Bar graphs represent mean±s.e.m. percentage of embryos with varying degrees of pigmentation: depigmented (<20 head melanophores), partially pigmented (21-39 head melanophores) and normally pigmented (40 and above). These were scored manually at 2 dpf, from embryos injected with control MO, Z2 MO, Z2 MO along with mouse H2a.z.1 mRNA or mouse H2a.z.2 mRNA across three independent biological replicates. Number of embryos analysed is given under the bars. (F) Inverted bar graphs represent mean±s.e.m. (n=3) percentage reduction in cell numbers of Z2 MO, compared with the control, in various marker lines. Time of assessment of labelled cells, their identity and the transgenic line used are indicated. (G) Whole-mount RNA in situ hybridization (WISH) assay showing the expression pattern of early neural crest markers foxd3, sox10 and tfap2a at 11 hpf. The assay resulted in the staining of migrating neural crest cells, which remained unaltered in the Z2 MO. (H) WISH-based expression pattern of neural crest markers crestin, sox10 and foxd3 at 24 hpf. Arrowheads in the foxd3 panel indicate tail tip neural crest cells. The numbers in the WISH images indicate frequency of the represented phenotype in the total number of embryos analysed. Scale bars: 100 μm. EXPRESSION / LABELING:
PHENOTYPE:
|
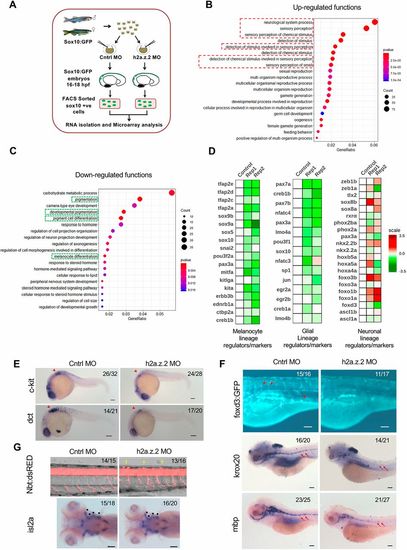
H2a.z.2 alters the neural crest gene regulatory network and decreases the melanocyte and glial footprint. (A) Schematic design of the microarray experiment. (B,C) Bubble plots representing gene ontology functions of differentially regulated genes with a log2 fold change ≤−0.6 (downregulated, B) and ≥0.6 (upregulated, C) upon the silencing of Z2 in sox10+ cells. (D) Heatmaps representing differential expression of key transcription factors and lineage markers in sox10+ cells of Z2 MO compared with the control across melanocyte, glial and neuronal lineages. (E) WISH-based expression pattern of melanocyte markers c-kit and dct at 24 hpf. Arrowhead represents vagal melanocytes. (F) Top: Tg(foxd3:GFP) labelling of glial cells that mark undifferentiated glia. Red arrowheads show cell population of interest. Middle and bottom: WISH of glial markers krox20 and mbp at 5 dpf. Red arrows indicate the glial lateral line. (G) Top: Tg(nbt:dsRed) labelling of neurons in the spinal cord bundle (lateral view). Yellow arrowheads mark the ectopic neurons. Bottom: WISH of the cranial motor neuron isl2a. Black dots represent motor neurons that arise from neural crest cells. The numbers in the top right corners of E, F and G indicate number of embryos with observed phenotypes/total number of embryos analysed. Scale bars: 100 μm. |
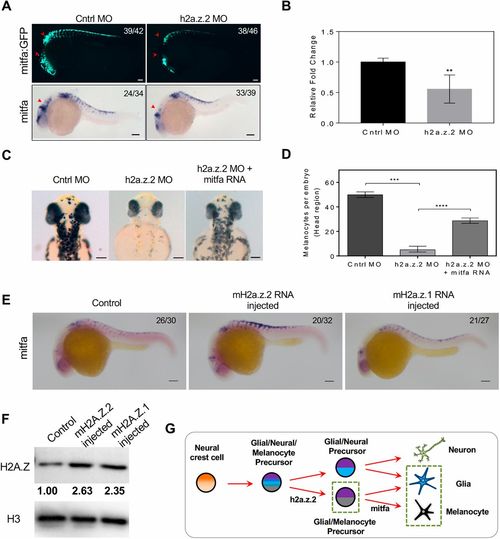
H2a.z.2 genetically interacts with mitf during melanocyte specification. (A) Top: Tg(mitfa:GFP) labelling of melanocytes. Red arrowheads indicate cranial and vagal melanocytes. Bottom: WISH of mitfa at 24 hpf. Red arrowheads indicate cranial melanocytes. (B) Real-time quantification of mitfa RNA upon Z2 MO indicates a ∼0.5-log2 fold downregulation in expression. Bars represent mean±s.e.m. across three independent biological replicates with ∼50 embryos each. (C) Bright-field images of control, Z2 MO and Z2 MO, co-injected with mitfa mRNA at 48 hpf, showing head melanophores. (D) Quantification of the rescue of head melanophore numbers upon mitfa RNA co-injection. Bars represent geometric mean with 95% CI of the number of head melanophores with at least 30 embryos each. (E) mitfa WISH at 24 hpf upon RNA injection of mouse H2a.z.2 or H2a.z.1, compared with the noninjected control. (F) Western blot analysis of H2AZ protein in noninjected or mouse H2a.z.2 or H2a.z.1 RNA-injected embryos, normalized to total H3 protein. (G) Schematic representation of the neural crest-derived lineages, highlighting the dependence of melanocyte and glial cells on h2a.z.2. The numbers in the WISH images indicate frequency of the represented phenotype in the total number of embryos analysed. Scale bars: 100 μm. |
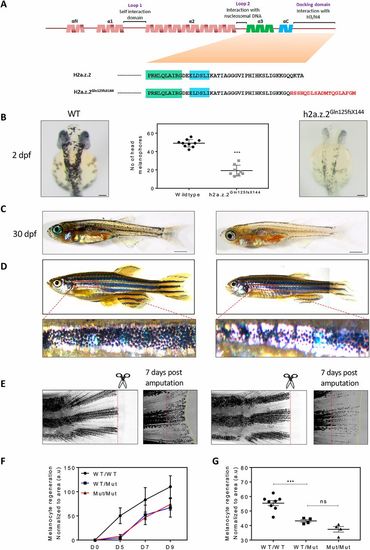
Targeted mutation of h2a.z.2 affects melanocyte specification and regeneration. (A) Top: orthology-based schematic of the secondary structure of zebrafish H2AZ.2. The functional elements in the protein are denoted above. Below: amino acid sequence in H2A.Z.2 and the CRISPR mutant (H2a.z.2Gln125fsX144) generated in this study. (B) Representative images of wild-type and Z2 mutant embryos at 2 dpf. Right: wild-type sibling control. Left: homozygous H2a.z.2Gln125fsX144 mutant embryo. Middle: quantification of head melanophore numbers. Scale bar: 100 µm. (C) Representative images of wild-type and Z2 mutant juveniles at 30 dpf. Scale bars: 1 mm. (D) Representative images of wild-type and Z2 mutant adult animals. Higher magnification images of the first ventral stripe are shown below. (Adult fishes were imaged in parts and stitched.) (E) Fin clip and regeneration images of adult wild-type and Z2 mutant animals. Red-dashed lines indicate the site of amputation and the yellow-dashed line indicates the margin of the regenerated fin. (F) Kinetics of melanophore pigment regeneration over a period of 9 days after fin amputation (n=4). (G) Quantification of melanophore pigment across wild-type (WT), homozygous and heterozygous H2a.z.2Gln125fsX144 mutants upon regeneration. |