
- Title
-
Large-scale cell-type-specific imaging of protein synthesis in a vertebrate brain
- Authors
- Shahar, O.D., Schuman, E.M.
- Source
- Full text @ Elife
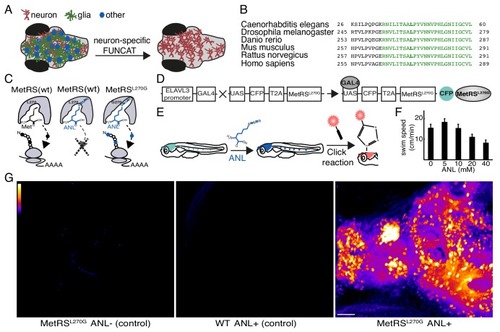
Cell-type-specific labeling of newly synthesized proteins.(A) Schematic demonstrating the method to visualize newly synthesized proteins in the brain in a cell-type-specific manner. (B) The protein sequence of the catalytic core domain of the MetRS in a number of species including Danio Rerio shows strong conservation (green). Leucine 270 (bold green) was mutated to Glycine to develop cell-type-specific metabolic labeling in zebrafish. (C) Schematic of the binding pocket of the MetRS and the ribosome during translation. The wt MetRS allows the charging of Met (black) that can be incorporated during translation initiation and elongation (left). The non-canonical amino acid ANL (blue), which contains an azide group, does not fit into the binding pocket of the wt MetRS, and thus is notincorporated into nascent protein (center). The mutant MetRSL270G can charge ANL, which is then incorporated into newly synthesized proteins (in cells expressing the MetRSL270G). (D) Schematic of the UAS-CFP-MetRSL270G line transgene. Crossing the line with any Gal4-expressing line allows for the metabolic labeling of newly synthesized proteins in any accessible cell type. (E) A scheme demonstrating the use of the ELAVL3-Gal4:UAS-CFP-MetRSL270G line. Left: a zebrafish larva expressing the transgene in neurons (cyan). Following addition of ANL to the water bath, newly synthesized proteins in neurons incorporate ANL (blue). Right: a whole mount click reaction with a fluorescent alkyne reveals the newly synthesized proteins (red). (F) The effect of different ANL concentrations on swim speed after 24 hr of ANL exposure (measurement was done in the presence of ANL). 10 mM ANL, which had no significant effect on larvae swimming, was used in further experiments. N = 5 to 6 larvae for each concentration. (G) Projections of confocal images of zebrafish larval brains after click reactions demonstrating the specificity of fluorescently labeled nascent protein in the MetRSL270G larva treated with ANL, but not in controls. Scale bar = 50 μm. |
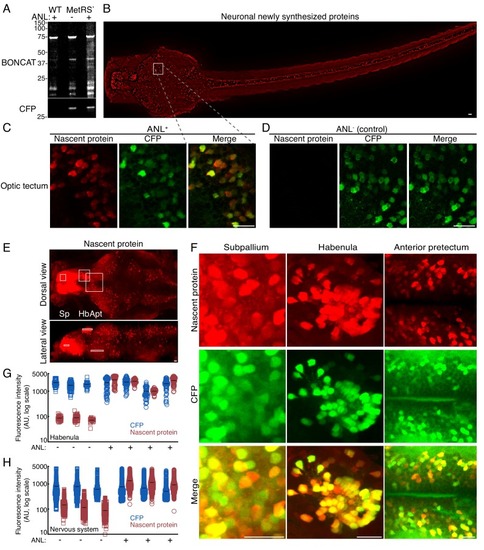
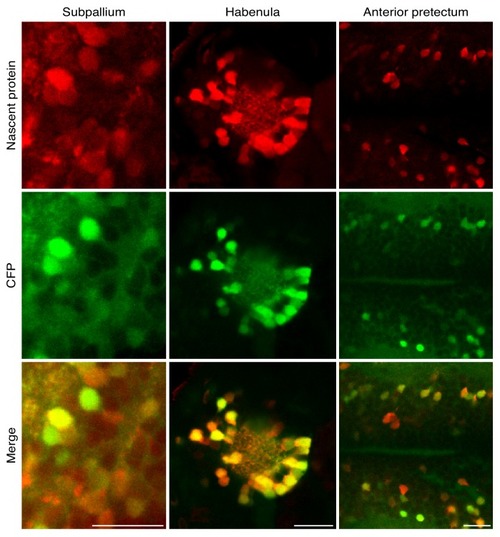
High resolution imaging newly synthesized proteins in different neuronal populations.3 dpf larvae were incubated with 10 mM ANL for 24 hr in vivo, fixed (at 4 dpf) and clicked to a biotin tag for BONCAT or a fluorescent tag to visualize nascent proteins in situ. (A) Immunoblot detecting newly synthesized proteins in WT larvae treated with ANL (WT ANL+, control), MetRSL270G (MerRS*) larvae treated with ANL (ANL +) or not (ANL-, control). (B) Dorsal view collage projection of confocal images showing fluorescently labeled newly synthesized neuronal proteins (red). (C-F) High magnification view of different brain regions. 4–6 confocal planes are shown (~10 microns in depth). Note the overlap between the CFP channel (Ab staining, green) and the nascent protein channel (click labeling, red), indicating that the signal is specific to cells expressing the MetRSL270G. (C-D) Optic tectum (Ot). (C) Shown are 4 planes of the region indicated by the square in B. (D) The same region in a larva not incubated with ANL demonstrating the CFP but not nascent protein labeling. (E) Maximal projection of labelled newly synthesized proteins in an entire brain (dorsal view and lateral view) (see Figure 2—figure supplement 2A–B for lower brightness). White frames indicate the subpallium (Sp), habenula (Hb) and anterior pretectum (Apt), regions zoomed in (in F). (F) CFP Ab staining and nascent protein labeling in 4–6 confocal images indicated in the white frames in E. See Figure 2—figure supplement 2for more brain regions. (G-H) Quantification of the average nascent protein levels in the habenula (G) and the entire nervous system (H). Neurons were segmented in 3D using the CFP channel (see supplementary material and Figure 2—figure supplements 6–7) and the average voxel fluorescence intensity for the CFP and fluorescently labeled nascent protein was measured in each cell. Plotted are the average fluorescence intensities in single cells. 30 to 60 neurons were segmented for each habenula of 4 ANL-treated and 3 control larvae (G). (H) Quantification of the average CFP and nascent protein fluorescence intensity in neurons across the entire nervous system. More than 1000 neurons were segmented in 3D using the CFP channel (similar to G). Plotted are the mean fluorescence intensities in single cells from 3 larvae treated (ANL+, squares) or not treated (ANL-, circles) with ANL. See Figure 2—figure supplement 5 for statistical differences between the groups. Squares: ANL- (control), circles: ANL+, blue: CFP, red: Nascent protein, black line – mean fluorescence intensity within a single larva. One cell had a nascent protein intensity value below ten and is shown on the x-axis. Scale bars = 20 μm. |
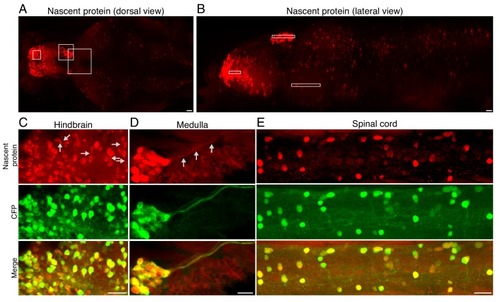
Fluorescently labeled nascent proteins in neurons across the zebrafish larva brain.(A-B) Maximum intensity projection of newly synthesized protein labeling in an entire brain (A) - dorsal view, B - lateral view) (same image as in Figure 2E,F with lower brightness to demonstrate the variability of nascent protein intensity in regions that appear saturated in Figure 2). White frames indicate the subpallium, habenula and anterior pretectum as in Figure 2E,F. (C-E) Maximum intensity projections of nascent protein labeling (red, top), and CFP Ab staining (green, middle) in indicated brain areas: hindbrain (C), the medulla (D), and the spinal cord (E). Note the nascent protein labeling in neuronal processes indicated in some examples (gray arrows in C, D). Scale bar = 20 μm. |
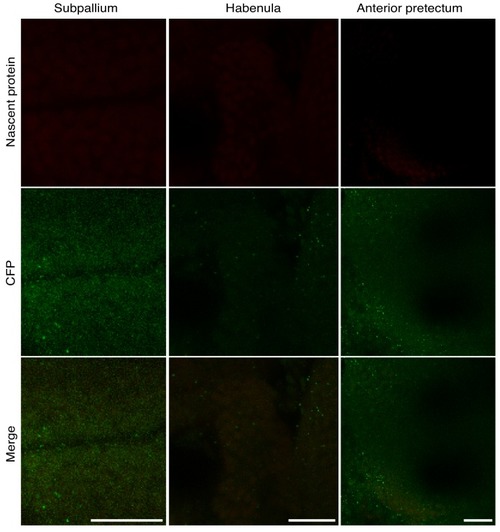
CFP Ab staining and ANL labeling were performed on WT zebrafish larvae. Shown are confocal images of the similar regions of the same dimensions (X, Y, Z) of the confocal images shown in |
3 dpf larvae were incubated with 10 mM ANL for 24 hr in vivo, fixed (at 4 dpf) and clicked to a fluorescent alkyne tag to label nascent proteins in situ. Shown are single planes of CFP Ab staining and nascent protein labeling of the regions in the images in |
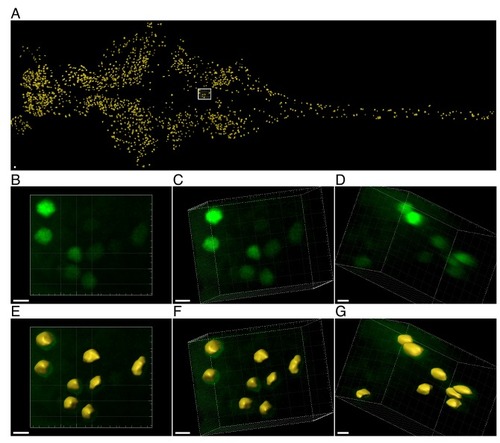
Click chemistry was performed to label nascent proteins. Antibody staining for CFP was performed to detect cells expressing CFP (and MetRSL270G) across the larvae. Individual neurons were segmented in 3D according to the CFP signal, before measuring nascent proteins (in the segmented ROIs). ( |
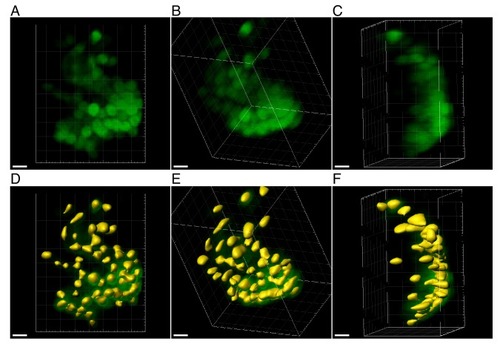
Zoom-in on a more challenging densely labeled ROI in the habenula. ( |
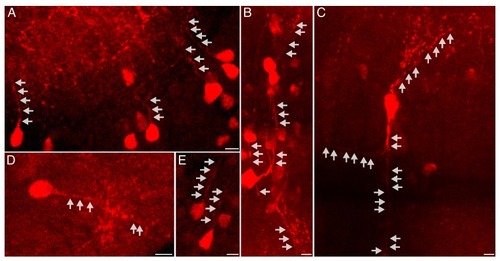
Representative images of cells exhibiting labeling of nascent proteins in neurites. Maximum intensity projections of 3–6 confocal planes (5.7–12 microns) are shown. Freely swimming larvae were incubated with ANL for 24 hr (same larvae as in |
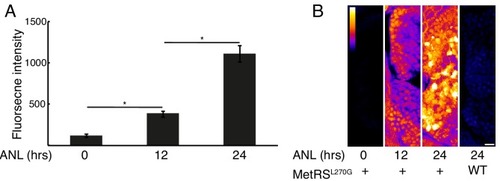
Larvae were incubated with 10 mM ANL in their water bath for the indicated durations before fixation and click reaction. ( |
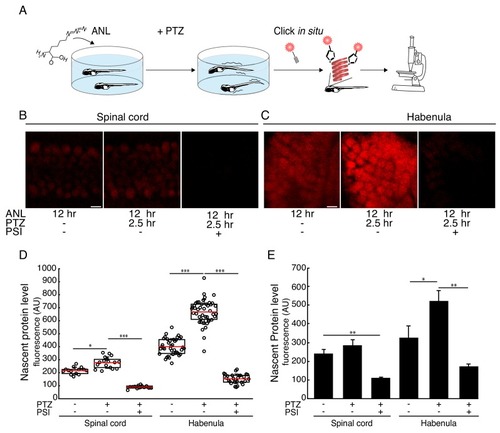
Seizure-induced neuron-specific protein synthesis.(A) Schematic of the experiment. Freely swimming larvae were incubated with ANL. After 10 hr incubation, PTZ was added for 2.5 hr, inducing seizures. Following fixation, whole-mount click with a fluorescent alkyne and confocal imaging were performed. (B-C) Representative images of the ANL signal in the spinal cord (B) or habenula (C). Shown are maximum projections of 4 confocal planes of the specific regions of larvae treated or non-treated with the protein synthesis inhibitor puromycin (PSI) and treated or non-treated with PTZ. (D) Quantification of the images shown in (B-C). Cells were segmented in 3D using the CFP channel, and the mean nascent protein labeling was measured in each cell using the fluorescent-alkyne channel. The dots represent the mean intensity in cells in the corresponding image (of B-C respectively). Red line – mean, whiskers - STDEV. (E) Bar plot showing the average nascent protein intensity in 3 to 5 larvae PTZ- and PTZ+, respectively. CFP positive cells in the spinal cord or the habenula were segmented in 3D using the CFP antibody staining. The levels of newly synthesized proteins were measured using the fluorescent alkyne (similar to D). More than 100 neurons in the spinal cord and 30 neurons in the habenula were analyzed. The average intensity was calculated for each larva. Plotted are the averaged intensities for each treatment (N = 3 to 5 larvae for each treatment). Error bars indicate SEM. *p<0.05, **p<0.01***p<0.001. Scale bars = 5 μm (B, C). |
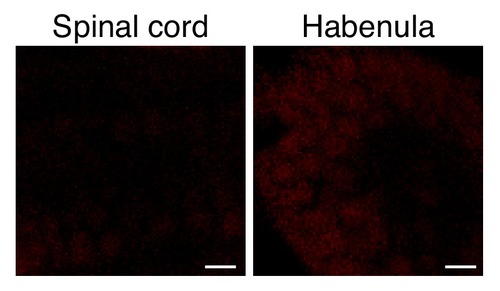
Seizure-induced neuron-specific protein noise levels in WT.Larvae were incubated with ANL and PTZ and were processed as described in Figure 4, for the ELAVL3-MetRSL270Gline. Scale bar = 5 μm. |