FIGURE SUMMARY
Title

Generation and Characterization of a CRISPR/Cas9 -Induced 3-mst Deficient Zebrafish

Authors
Katsouda, A., Peleli, M., Asimakopoulou, A., Papapetropoulos, A., Beis, D.
Source
Full text @ Biomolecules

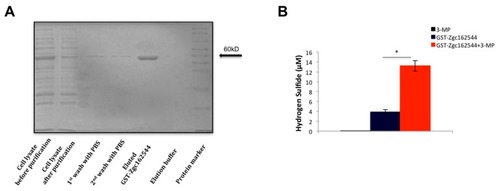
Purification and enzymatic activity of recombinant GST-Zgc162544. (A) Representative SDS-PAGE of all fractions collected after different purification steps of GST-Zgc162544. (B) H2S production by GST-Zgc162544 in the presence of 3-MP. Data are presented as mean ± SEM; n = 6–7; * P < 0.05.

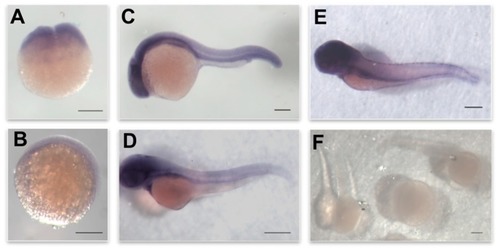
Expression pattern of 3-mst during zebrafish development. Whole mount in situ hybridization of 3-mst in zebrafish embryos at (A) 0 hpf, (B) 8 hpf, (C) 24 hpf, (D) 48 hpf and (E) 72 hpf. (F) Sense probe at the stages shown in (A–E). Scale bar 250 μΜ.

EXPRESSION / LABELING:
Gene:
Fish:
Anatomical Terms:
Stage Range: 1-cell to Protruding-mouth

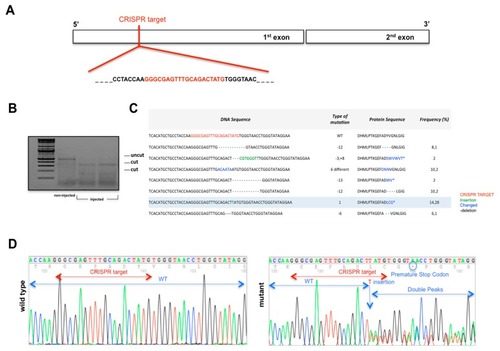
Generation of 3-mst mutant zebrafish using the clustered, regularly interspaced, short palindromic repeats (CRISPR)-Cas9 approach. (A) Schematic representation of 3-mst-CRISPR-target site. (B) Gel electrophoresis of T7E1 assay in a representative sampling of CRISPR-injected and non-injected controls. (C) Type and frequency of alleles, identified in F1 generation. (D) Sequencing chromatograms of wild type and the mutant allele (aa102), selected for further studies, showing the presence of a premature stop codon.

3-mst−/− zebrafish exhibit decreased H2S production. (A) Representative Western blot shows no detectable 3-Mst protein in the 3-mst−/− larvae at 96 hpf. β-tubulin was used as a loading control. (B) H2S levels were measured by the methylene blue assay in WT and 3-mst−/− zebrafish at 96 hpf. (C) H2S levels were measured by the AzMC probe in WT and 3-mst−/−zebrafish at 96 hpf. Data are presented as mean ± SEM; n = 5–7/genotype; * P < 0.05.

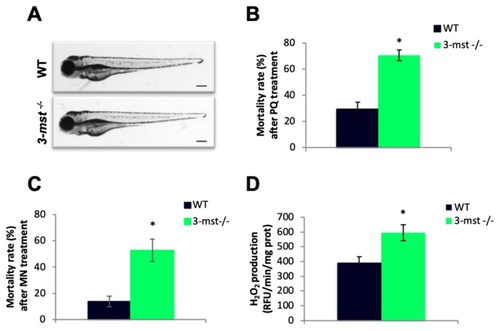
Increased H2O2 production and oxidative stress sensitivity in 3-mst−/− zebrafish. (A) Microscopic images show normal gross morphology of 3-mst−/− larvae at 96 hpf in comparison with WT larvae. Black scale bar: 250 μΜ. (B) Mortality rate of WT and 3-mst−/− larvae after PQ treatment. (C) Mortality rate of WT and 3-mst−/− embryos after menadione (MN) treatment (D) Zebrafish H2O2 levels measured by Amplex Red Fluorescence in homogenates of WT and 3-mst−/− at 96 hpf. Data are presented as mean ± SEM; n = 6–12/genotype; * P < 0.05.

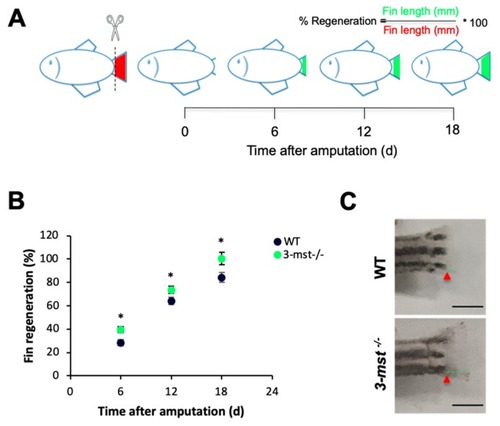
3-mst−/− zebrafish exhibit increased caudal fin regeneration rate. (A) Experimental protocol. (B) Caudal fin regeneration rate of WT and 3-mst−/− adult zebrafish at different time points after tail amputation. (C) Representative fin images of WT and 3-mst−/− adult zebrafish at six days after amputation. Red arrows indicate original section plane. Green lines indicate fin length after regeneration. Black scale bar: 2 mΜ. Data are presented as mean ± SEM; n = 16/genotype; * P < 0.05.

Acknowledgments
This image is the copyrighted work of the attributed author or publisher, and ZFIN has permission only to display this image to its users. Additional permissions should be obtained from the applicable author or publisher of the image. Full text @ Biomolecules