
- Title
-
An Activity-Based Methionine Bioconjugation Approach To Developing Proximity-Activated Imaging Reporters
- Authors
- Ohata, J., Krishnamoorthy, L., Gonzalez, M.A., Xiao, T., Iovan, D.A., Toste, F.D., Miller, E.W., Chang, C.J.
- Source
- Full text @ ACS Cent Sci
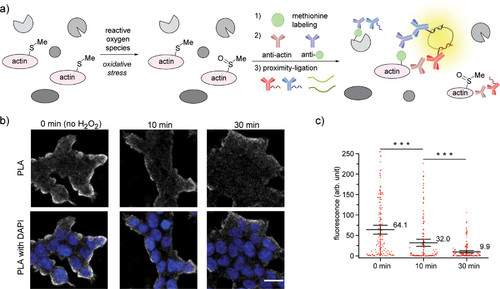
“Turn-off” detection of oxidative stress in cells via methionine proximity-activated imaging reporter (Met-PAIR) on β-actin. (a) Schematic for Met-PAIR on β-actin. (b) Confocal images of β-actin Met-PAIR on HEK293T cells preincubated with H2O2 (1 mM) for 0, 10, or 30 min, washed, and labeled with alkyne-tagged oxaziridine (Ox4, 20 μM) for 20 min. Ox4-labeled β-actin was further functionalized with Oregon Green-azide, and proximity-ligation assay (PLA) stain was performed with mouse anti-β-actin antibody and rabbit anti-Oregon Green antibody. Gray: PLA staining. Blue: DAPI nuclear staining. Scale bar: 20 μm. (c) Whisker plots for the confocal images in (b). Each dot represents fluorescence intensity of single cells. Whisker and center line represent 95% confidence interval and mean intensity, respectively. The mean value is shown near the center line. The quantification was conducted by imaging 4 regions in each of 2 independent biological replicates (total 8 cell images). The number of the quantified cells: 119 (0 min), 131 (10 min), and 157 (30 min). ***P < 0.001, Student’s t test. |
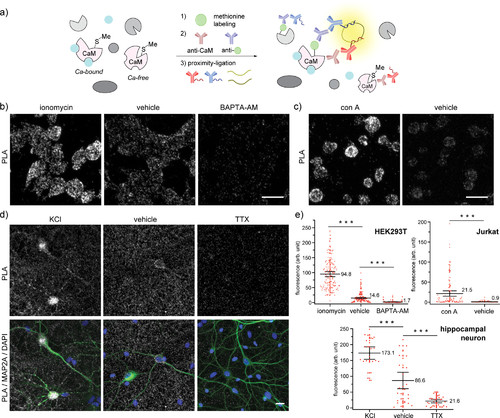
“Turn-on” detection of changes in calcium levels in cells by applying the methionine proximity-activated imaging reporter (Met-PAIR) method to the native calcium regulatory protein calmodulin (CaM) at endogenous levels. Oxaziridine labeling in live cells was conducted in the presence of various reagents in Hanks’ balanced salt solution (HBSS) with alkyne-tagged oxaziridine (Ox4, 20 μM) at rt for 20 min (HEK293T and Jurkat) or with Ox4 (0.5 μM) at 37 °C for 5 min (hippocampal neurons). Proximity-ligation assay (PLA) staining was performed with mouse anti-CaM antibody and rabbit anti-Oregon Green antibody (HEK293T and Jurkat) or rabbit anti-biotin antibody (neuron). Gray: PLA staining. Blue: DAPI nuclear staining. Scale bar: 20 μm. (a) A schematic illustration of Met-PAIR on CaM. Blue ball: calcium ions in live cells. (b) Confocal images of HEK293T cells stained by Met-PAIR with intracellular calcium increases (ionomycin: 10 μM) or decreases (BAPTA-AM: 30 μM). (c) Confocal images of Jurkat cells stained by Met-PAIR with concanavalin A (con A, 0.1 mg/mL) to trigger calcium increases over vehicle control. (d) Confocal images of rat hippocampal neuron stained by Met-PAIR with activation (KCl: 90 mM) or deactivation (tetrodotoxin, TTX: 10 μM) to increase or decrease calcium transients, respectively. Anti-MAP2A antibody (green) was used to identify neurons. (e) Whisker plots for the confocal images in (b) HEK293T, (c) Jurkat, and (d) neurons. Each dot represents the fluorescence intensity of single cells or neuronal cell bodies. Whisker and center line represent 95% confidence interval and mean intensity, respectively. The mean value is shown near the center line. The quantification was conducted by imaging 4 regions in each of 2 independent biological replicates for HEK293T and Jurkat (total 8 cell images), and 5 regions in each of 2 independent biological replicates (total 10 images) were used for the quantification of neuronal cell bodies identified by the MAP2A staining. The number of quantified cells: 139 (ionomycin), 164 (HEK293T vehicle), 170 (BAPTA-AM), 113 (con A), 105 (Jurkat vehicle), 24 (KCl), 30 (neuron vehicle), and 32 (TTX). ***P < 0.001, Student’s t test. |
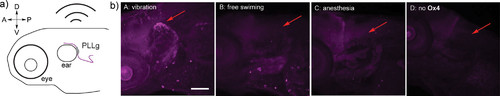
Methionine proximity-activated imaging reporter (Met-PAIR) staining on calmodulin (CaM) in zebrafish with external stimulation. Live zebrafish (3 day post-fertilization) were treated with Ox4 (100 μM) at rt for 20 min, further functionalized with biotin-azide via copper-catalyzed azide alkyne cycloaddition (CuAAC), and stained by mouse anti-CaM antibody and rabbit anti-biotin antibody as primary antibody and proximity-ligation assay (PLA) reagents. (a) Schematic illustration of the head of zebrafish for stimulation of posterior lateralis ganglion (PLLg) response through physical vibration. A: Anterior. D: Dorsal. P: Posterior. V: Ventral. (b) Representative confocal images of zebrafish stained by Met-PAIR with increases (vibration) or decreases (anesthesia with 920 μM tricaine) in local calcium. The images are representative of six biological replicates for each condition. PLA signal is shown in magenta. PLLg is noted with a red arrow. DAPI counterstaining and merged images are shown in Figure S17. Scale bar: 100 μm. |